Technical Analysis: Consolidation | Internet News

Technical Analysis: Consolidation

Written By
Paul Shread
Paul Shread
Mar 23, 2007
1 minute read

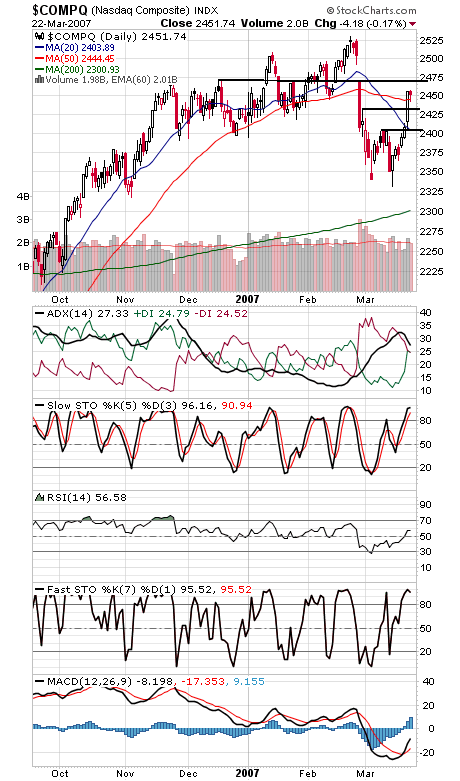
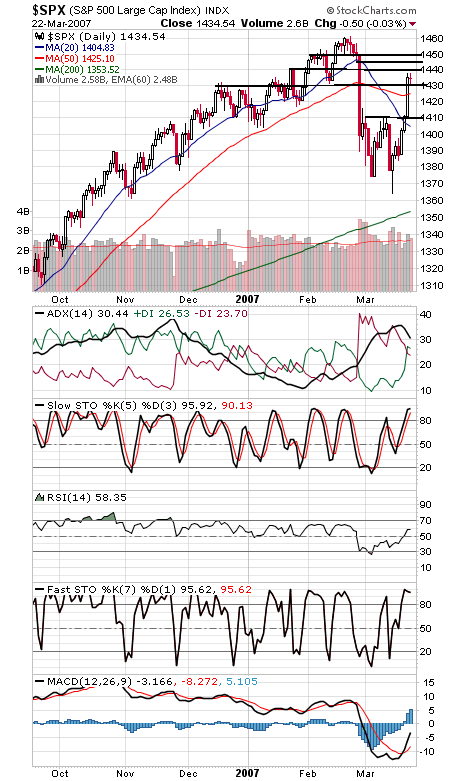
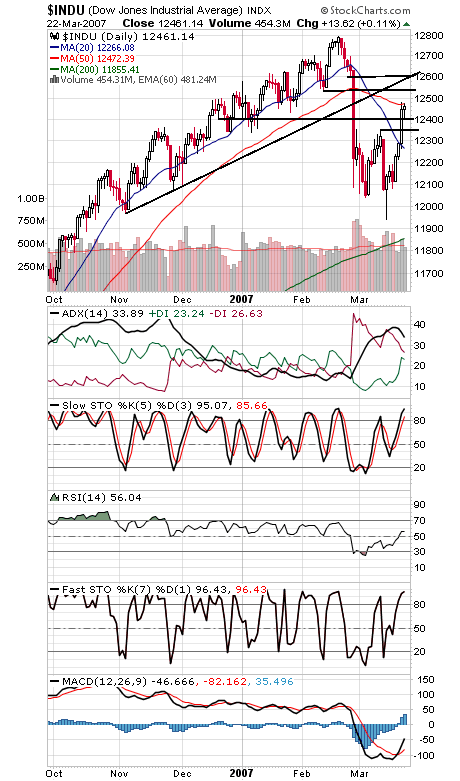
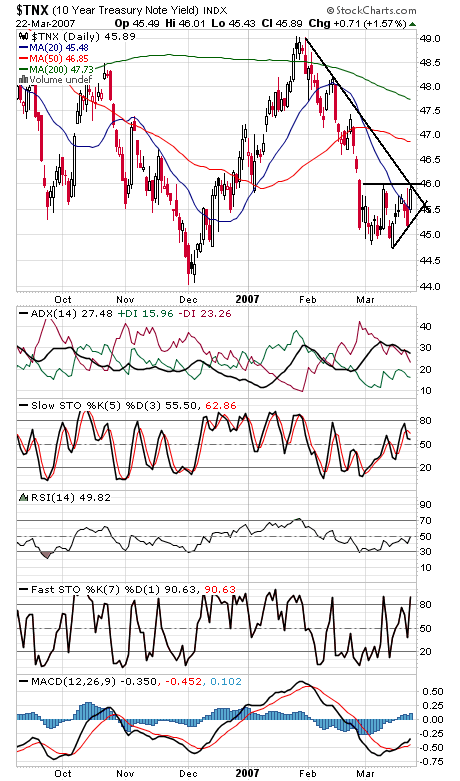
Stocks behaved well today after yesterday’s big gains. In the short term, the market seems bounded by the Dow’s 50-day average to the upside and the Nasdaq’s 50-day average to the downside. We could still see a pullback to test the recent breakouts, but the market’s risk remains to the upside, as it has for some time. The Nasdaq (first chart below) has support at 2440-2445 and 2432, and resistance is 2457 and 2471. The S&P (second chart) faces resistance at 1438-1440, 1445 and 1450, and support is 2430 and 2425. The Dow (third chart) remains the index most likely to retest yesterday’s breakout. Support is 12,400 and 12,350, and resistance is 12,473, 12500, 12,550 and 12,600. Bond yields (fourth chart) look ready to make their own upside move.


Internet News Logo

InternetNews is a source of industry news and intelligence for IT professionals from all branches of the technology world. InternetNews focuses on helping professionals grow their knowledge base and authority in their field with the top news and trends in Software, IT Management, Networking & Communications, and Small Business.

Property of TechnologyAdvice. © 2026 TechnologyAdvice. All Rights Reserved

Advertiser Disclosure: Some of the products that appear on this site are from companies from which TechnologyAdvice receives compensation. This compensation may impact how and where products appear on this site including, for example, the order in which they appear. TechnologyAdvice does not include all companies or all types of products available in the marketplace.