Technical Analysis: Correction Time | Internet News

Technical Analysis: Correction Time

Written By
Paul Shread
Paul Shread
May 8, 2008
1 minute read

The indexes didn’t get very far into our resistance zone before correcting. With any luck, the pullback will be just as shallow.

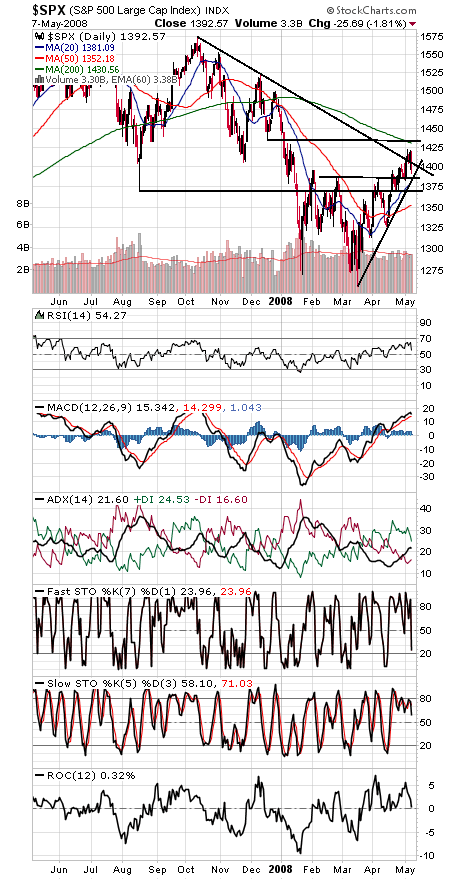
The S&P (first chart below) has support at 1385-1390 and 1370, and we’d like to see the correction hold there. To the upside, 1430-1435 is the level we want to see cleared, and 1400-1406 the first hurdle.

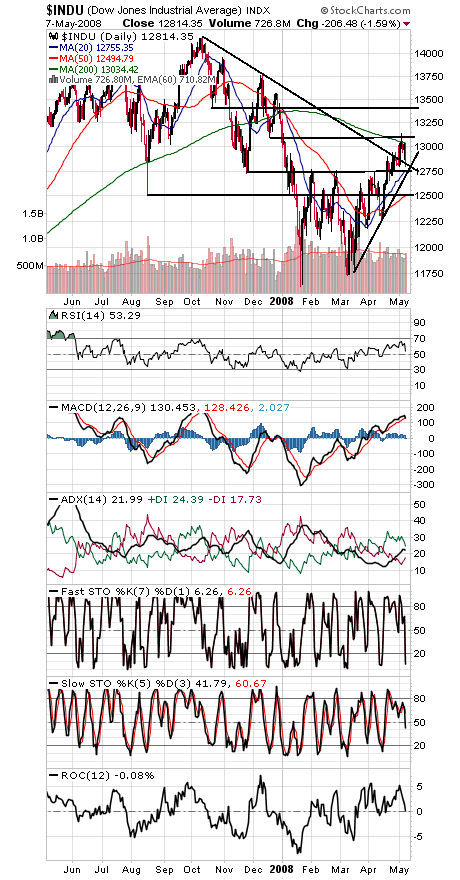
On the Dow (second chart), we’d like to see 12,743 hold or 12,500 could come back into play. To the upside, 13,000-13,100 is once again resistance.

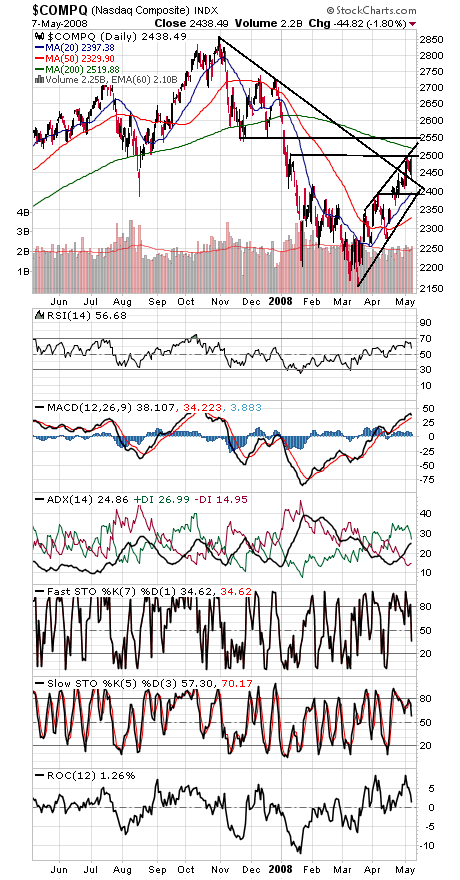
2390-2400 is critical support on the Nasdaq (third chart), while 2500-2550 is a very big hurdle for the bulls. 2425-2430 is first support for the techs.

In short, not a surprising place for a pullback, but one we’d like to see remain shallow, in keeping with market history after Dow Theory buy signals and important support levels just below here.

Paul Shread is a Chartered Market Technician (CMT) and member of the Market Technicians Association.

Internet News Logo

InternetNews is a source of industry news and intelligence for IT professionals from all branches of the technology world. InternetNews focuses on helping professionals grow their knowledge base and authority in their field with the top news and trends in Software, IT Management, Networking & Communications, and Small Business.

Property of TechnologyAdvice. © 2026 TechnologyAdvice. All Rights Reserved

Advertiser Disclosure: Some of the products that appear on this site are from companies from which TechnologyAdvice receives compensation. This compensation may impact how and where products appear on this site including, for example, the order in which they appear. TechnologyAdvice does not include all companies or all types of products available in the marketplace.