We’re going to devote tonight’s technical analysis column to exponential moving averages on the S&P 500, which have been playing an important role in market action the last two months.
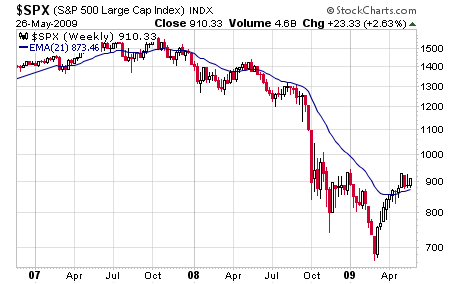
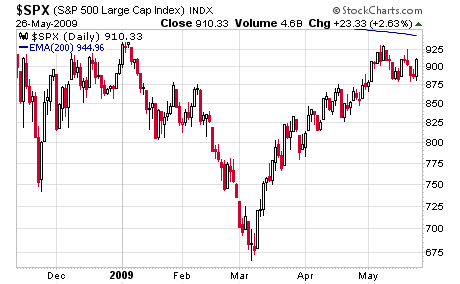
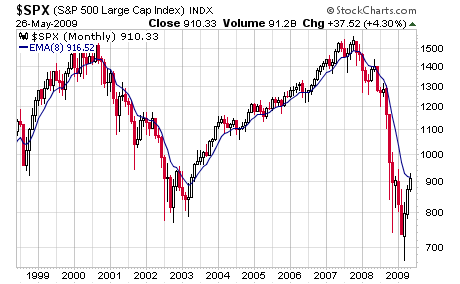
The best-performing longer-term moving averages on the S&P since 1962 have been the 200-day, 21-week and 8-month EMAs. We chose 1962 to encompass complete cycles of rising and falling interest rates.
Since 1962, the S&P 500 has averaged 6.62% a year, not including dividends. Buying when the monthly close is above the 8-month EMA and selling on a monthly close below has returned 6.93% a year, using Amibroker and Yahoo Finance data. Buying and selling daily closes above and below the 200-day EMA has averaged 8.46% a year, and buying and selling weekly closes above and below the 21-week EMA has returned 7.7% a year.
The simple EMA trend-following systems have accomplished that while only being in the market about 70% of the time, avoiding the steep drawdowns that bear markets can inflict on an account. While not ideal systems — the low win ratios alone would make them tough to stick with, particularly the sub-40% win rates for the weekly and daily EMAs — they’re nonetheless good examples of how a simple trading system can beat buy and hold over time.
What’s interesting is how those moving averages have had much to do with the market action of the last two months.
Since closing above the 21-week EMA seven weeks ago (see first chart below), the S&P has tested and held that area several times (also the site of 875 support, the top of the initial leg up in March).
The rally stalled recently at 930, just below the January high of 944 and the 200-day EMA in the same vicinity (second chart below).
And the index ended today just below the 8-month EMA at 917, with three trading days to go in the month (third chart below). The S&P hasn’t had a monthly close above that average since the October 2007 top. It missed by a point last May, and the worst month of June since the Great Depression followed.
So there is much at stake in the stock market the next three days, and the S&P needs just 7 more points to get the job done.
Paul Shread is a Chartered Market Technician (CMT) and member of the Market Technicians Association. He is a co-author of the book “Dow Theory Unplugged” from W&A Publishing.