About the only good news today is that the stock market is now deeply oversold.
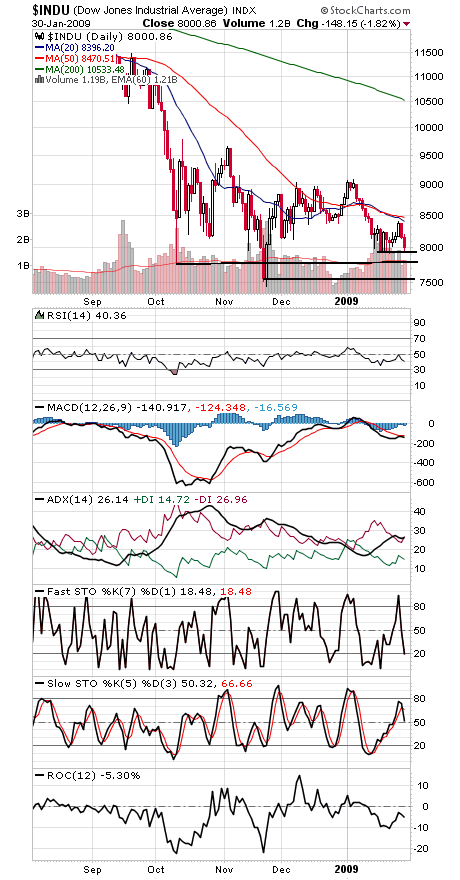
The Dow has fallen 37.6% in the last nine months, a reading last seen at the late 1937-early 1938 lows, when it hit –40% at the low (thanks to Martin Pring’s “Technical Analysis Explained”). The only nine-month period in the 113-year history of the Dow worse than this was the final year of the 1929-1932 bear market.
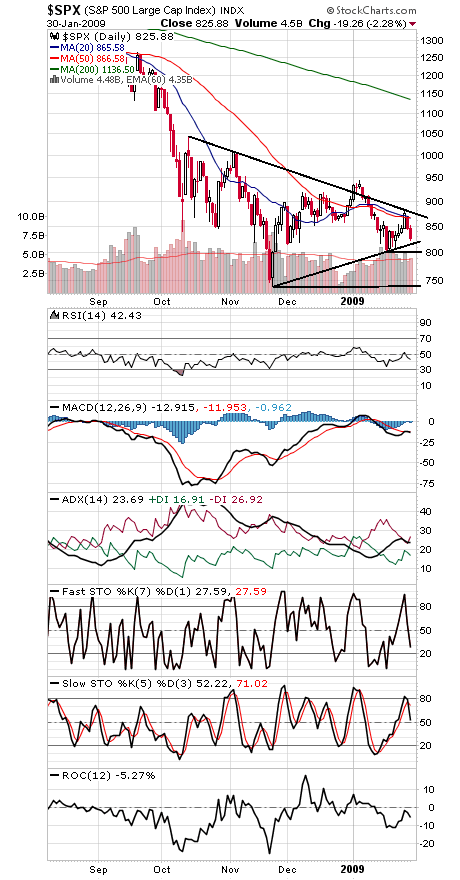
The S&P (first chart below) needs to hold 800 or a complete retest of the November low of 741 could be on tap. 820 could be a good first support level. 866-878 is very important resistance to the upside.
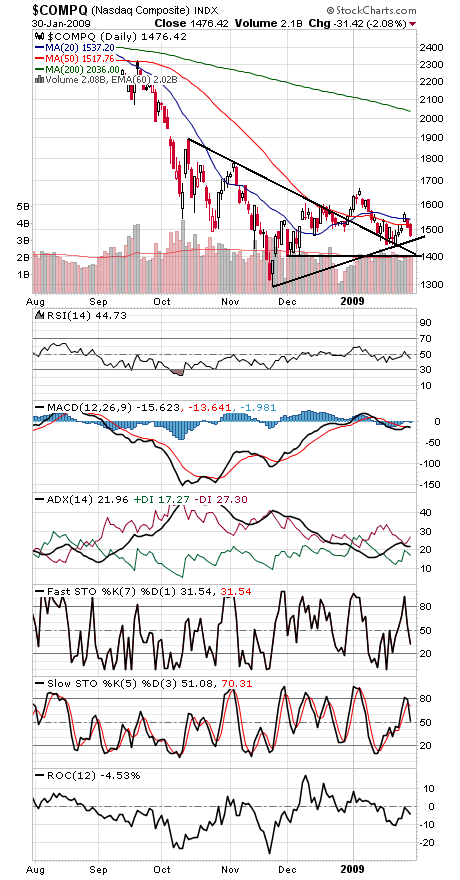
The Nasdaq (second chart) has support at 1460, 1434 and 1400, and resistance is 1500-1518 and 1567.
The Dow (third chart) has support at 7800-7900 and 7507, and 8405-8500 is the big upside hurdle.
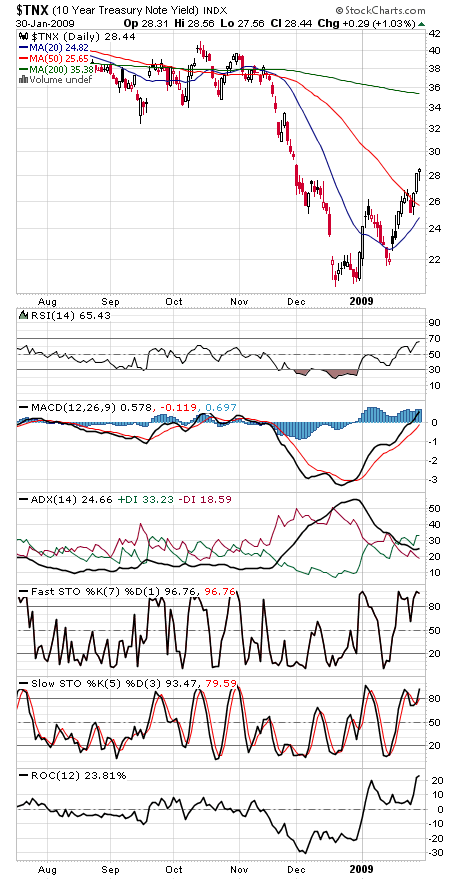
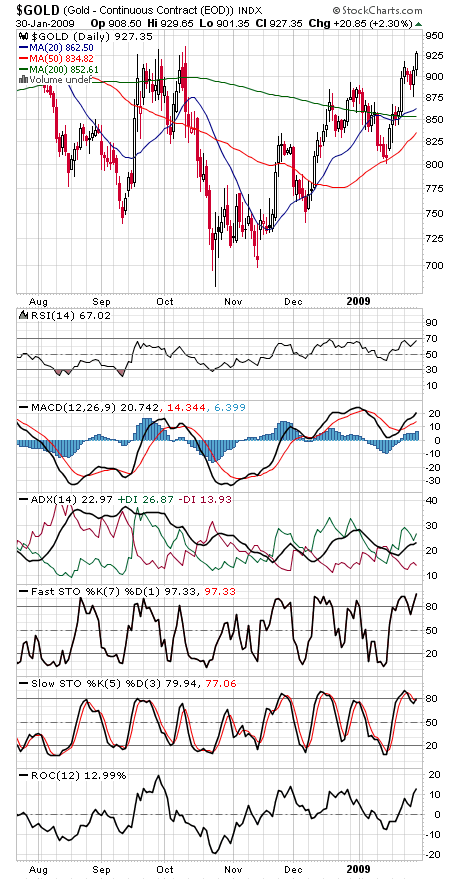
Finally, it sure is starting to look like the money from treasuries (chart four) is going into gold (chart five). It sure doesn’t seem to be finding its way into stocks.
Paul Shread is a Chartered Market Technician (CMT) and member of the Market Technicians Association.