Technical Analysis: Dow Breaks Down | Internet News

Technical Analysis: Dow Breaks Down

Written By
Paul Shread
Paul Shread
Jun 7, 2006
1 minute read

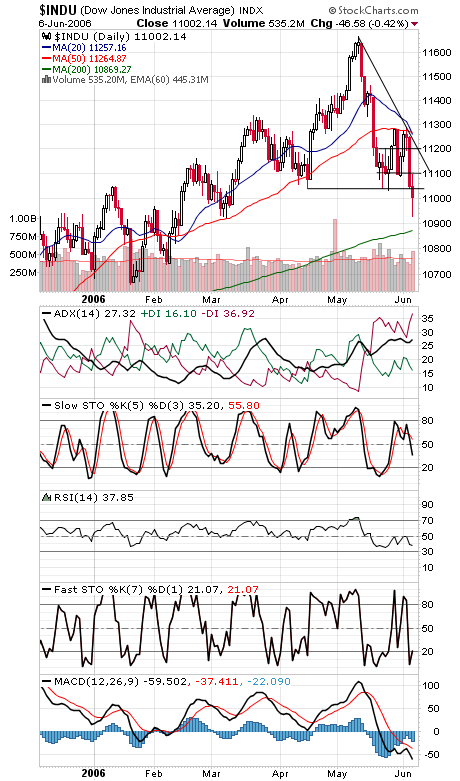
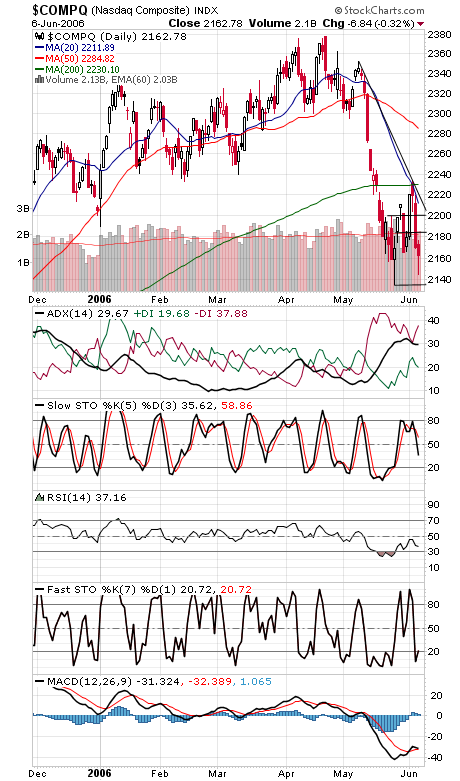
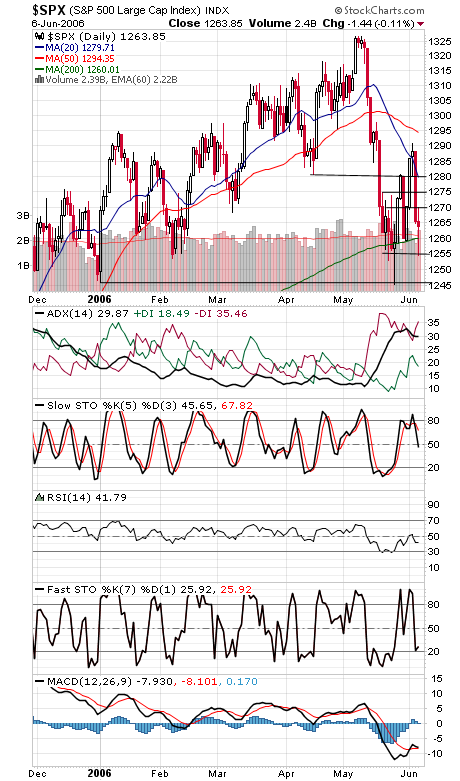
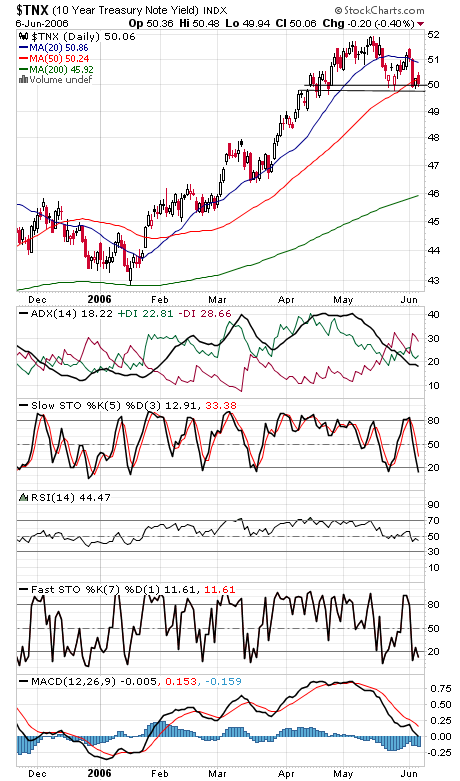
The Dow (first chart below) became the latest index to lose a major support level today, closing below the neckline of a potential head and shoulders top at 11,030-11,040. The blue chips now need to reclaim that level; the size of that pattern suggests a minimum downside target of 10,400-10,700, and the breakdown occurs with the weakest months of the four-year market cycle ahead of us. The next support levels are 10,925 and 10,870. The Nasdaq (second chart) continues to fare better than the Dow as of late, putting in a higher low today. Support is 2144 and 2125-2135, and resistance is 2176, 2185 and 2200. The S&P (third chart) is doing even better. Support is 1260, 1254 and 1245-1250, and resistance is 1270, 1275 and 1281. Can long bond yields (fourth chart) make a definitive break below 5%?


Internet News Logo

InternetNews is a source of industry news and intelligence for IT professionals from all branches of the technology world. InternetNews focuses on helping professionals grow their knowledge base and authority in their field with the top news and trends in Software, IT Management, Networking & Communications, and Small Business.

Property of TechnologyAdvice. © 2026 TechnologyAdvice. All Rights Reserved

Advertiser Disclosure: Some of the products that appear on this site are from companies from which TechnologyAdvice receives compensation. This compensation may impact how and where products appear on this site including, for example, the order in which they appear. TechnologyAdvice does not include all companies or all types of products available in the marketplace.