Technical Analysis: Dow Breaks Down | Internet News

Technical Analysis: Dow Breaks Down

Written By
Paul Shread
Paul Shread
May 19, 2006
1 minute read

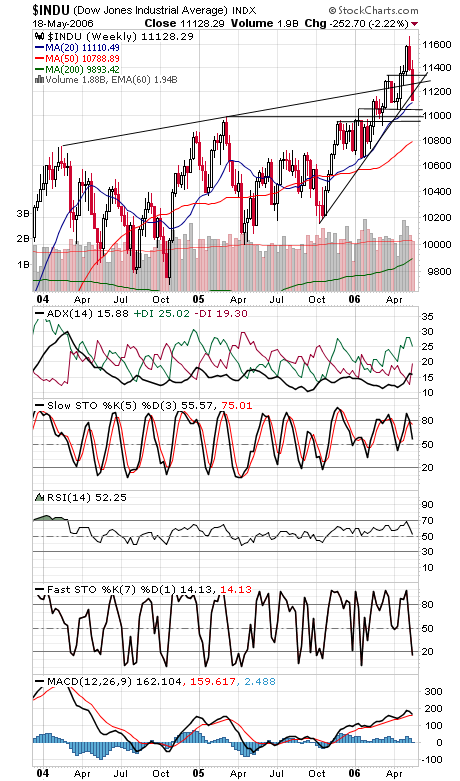
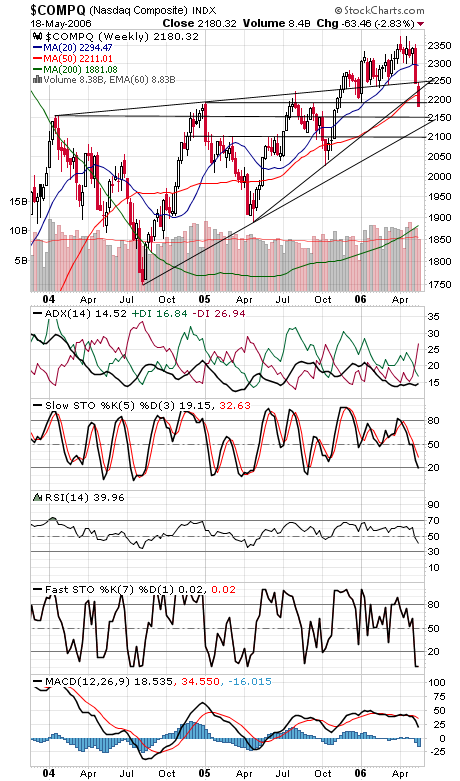
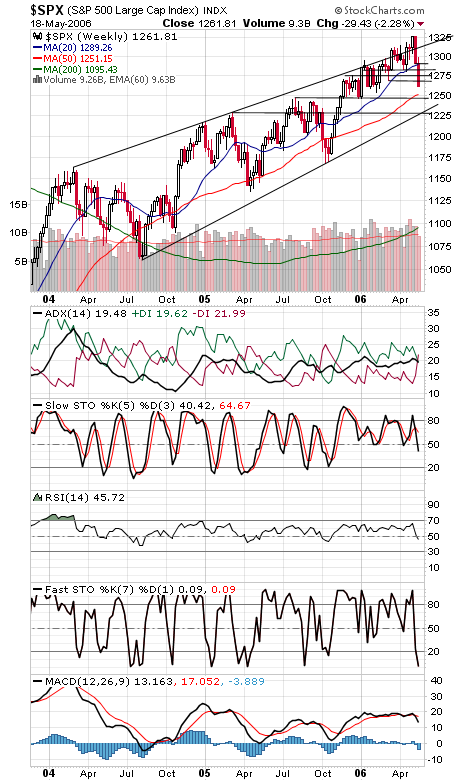
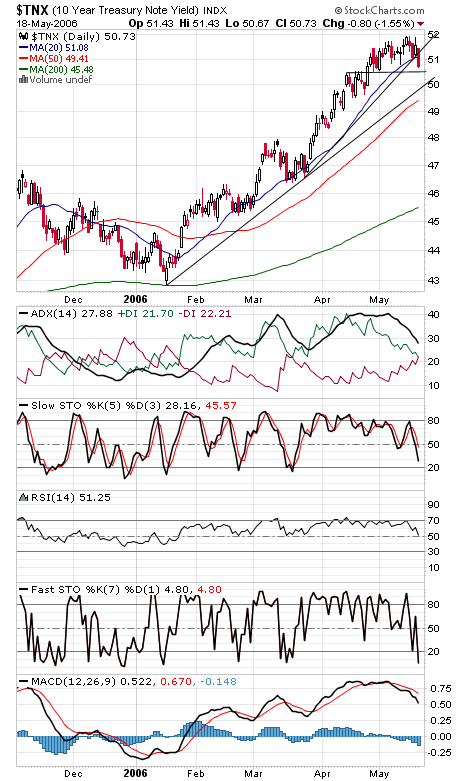
The Dow (first chart below) became the last of the major indexes to break down today. The next support levels are 11,040-11,050, 11,000 and 10,960, and resistance is 11,175, 11,275-11,280 and 11,330-11,350. The Nasdaq (second chart) continues to lose support levels. 2150, 2125 and 2100 are the next big support levels, and resistance is 2190-2200, 2211, 2220, 2229 and 2245-2250. The S&P (third chart) has support at 1257-1258 and 1246-1251, with 1230 a big level below that, and resistance is 1267-1268, 1275, 1282-1284 and 1288-1290. A big drop in long bond yields (fourth chart) today; looks more like fear of a slowdown than of inflation.


Internet News Logo

InternetNews is a source of industry news and intelligence for IT professionals from all branches of the technology world. InternetNews focuses on helping professionals grow their knowledge base and authority in their field with the top news and trends in Software, IT Management, Networking & Communications, and Small Business.

Property of TechnologyAdvice. © 2026 TechnologyAdvice. All Rights Reserved

Advertiser Disclosure: Some of the products that appear on this site are from companies from which TechnologyAdvice receives compensation. This compensation may impact how and where products appear on this site including, for example, the order in which they appear. TechnologyAdvice does not include all companies or all types of products available in the marketplace.