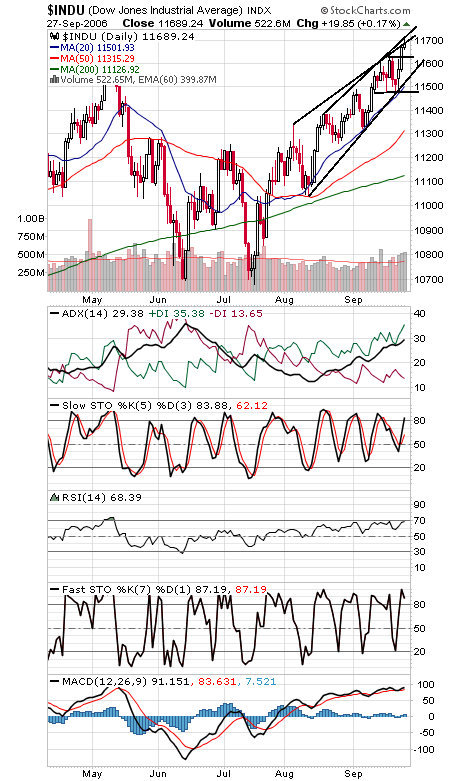
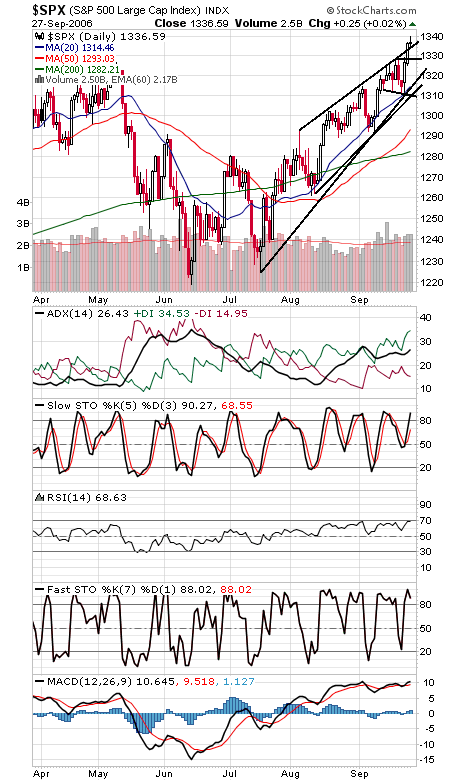
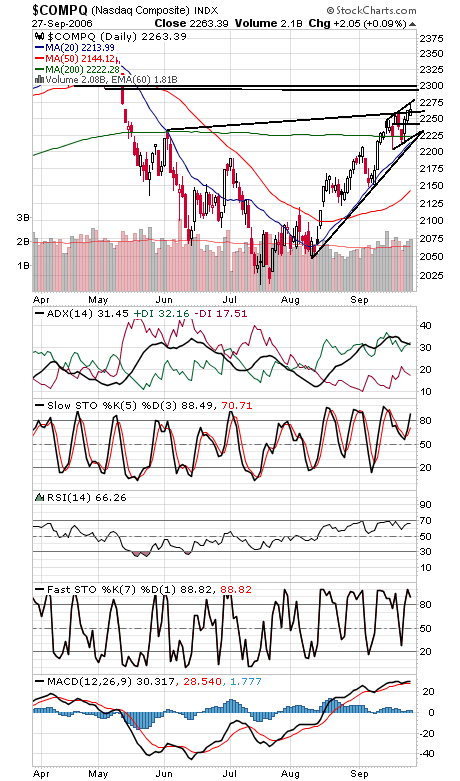
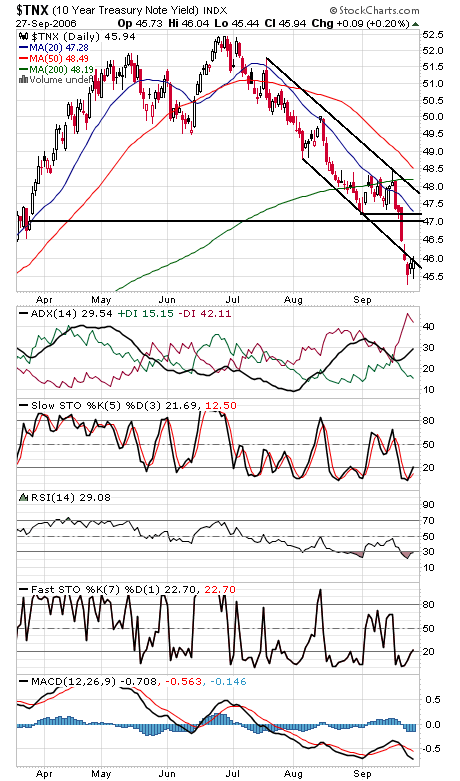
The Dow (first chart below) came within two points of its all-time high of 11,722-11,750, a magnet that is so far keeping traders from worrying about growing evidence of an economic slowdown. That said, between end-of-the-quarter window dressing and first-of-the-month inflows, another attempt is likely in the next few days. After that, we’ll see what October brings. While the Dow nears its record close, a number of indexes that set new all-time highs earlier this year, such as the Transports, Russell 2000 and NYSE, are lagging badly, another sign of a rally that seems vulnerable to a pullback. Support on the Dow is 11,660, 11,630, 11,600 and 11,535, which looks particularly critical here. The S&P (second chart) got stopped at 1340-1342 resistance today. Support is 1335, 1333, 1330 and 1326-1327. The Nasdaq (third chart) cleared 2262 resistance today. 2275-2280 and 2293-2300 are next, and support is 2253-2254, 2250 and 2243. Bond yields (fourth chart) are pausing here, but so far not giving up much.