SHARE
Facebook X Pinterest WhatsApp

Technical Analysis: Dow Leads to the Downside

Written By
thumbnail
Paul Shread
Paul Shread
Jul 8, 2006

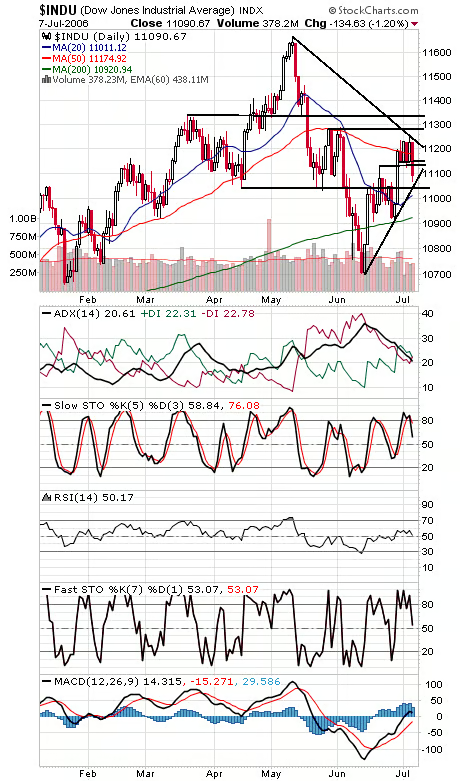
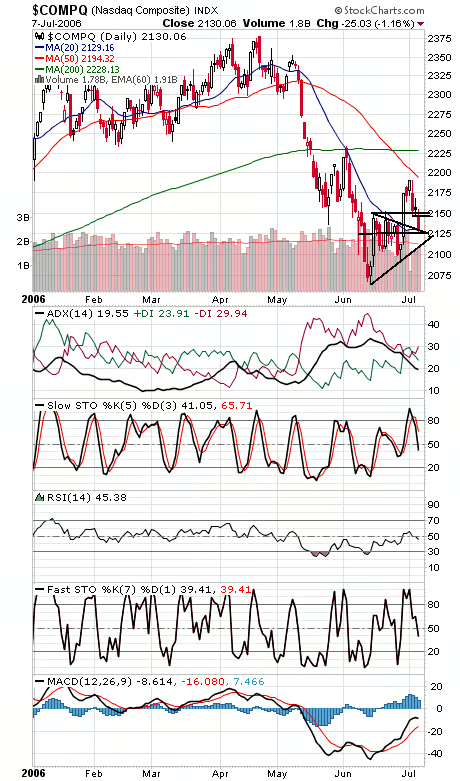
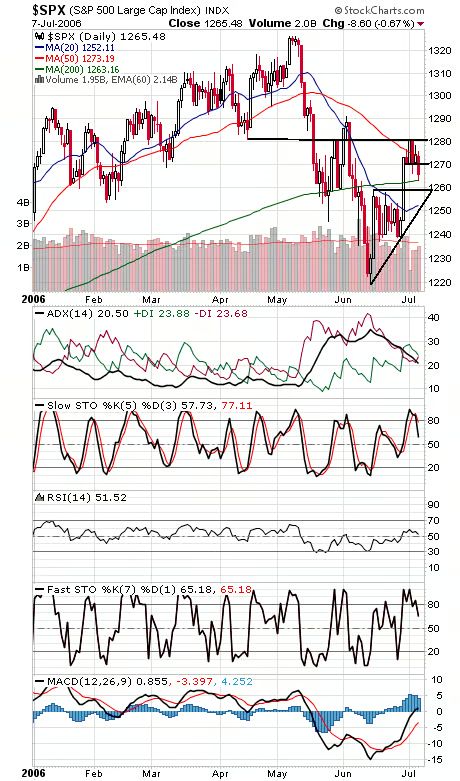
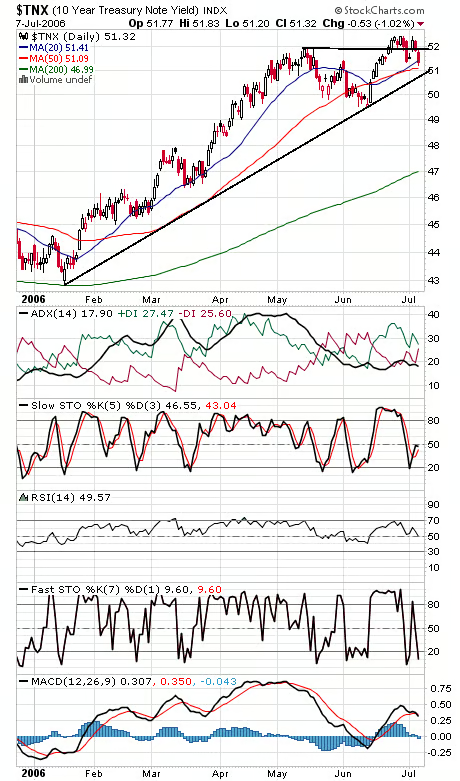
The Dow (first chart below) led to the downside for a change. 11,040-11,066 is important support, and resistance is 11,131-11,150, 11,175 and 11,240. The Nasdaq (second chart) has important support at 2113, and 2150 is now resistance again. The S&P (third chart) held up relatively well due to its heavy financial weighting. The index has support at 1263, 1259 and 1253, and resistance is 1270, 1273 and 1281. At least bond traders had a good day today (fourth chart). Nice technical action there, breaking support, retesting it from below, and then continuing lower.


Recommended for you...

U.S. Needs to Protect Tech Leadership: Qualcomm
Rob Enderle
Apr 8, 2022
HP’s ExtendXR Service Gets an Early Lead on a Looming Metaverse Problem
Rob Enderle
Mar 5, 2022
Cisco’s Purpose Is to Improve the World. Imagine if Others Followed.
Rob Enderle
Dec 17, 2021
HP Builds an Advanced Cloud Workstation for the Metaverse
Rob Enderle
Nov 13, 2021
Internet News Logo

InternetNews is a source of industry news and intelligence for IT professionals from all branches of the technology world. InternetNews focuses on helping professionals grow their knowledge base and authority in their field with the top news and trends in Software, IT Management, Networking & Communications, and Small Business.

Property of TechnologyAdvice. © 2025 TechnologyAdvice. All Rights Reserved

Advertiser Disclosure: Some of the products that appear on this site are from companies from which TechnologyAdvice receives compensation. This compensation may impact how and where products appear on this site including, for example, the order in which they appear. TechnologyAdvice does not include all companies or all types of products available in the marketplace.