Technical Analysis: Dow Nears All-Time High | Internet News

Technical Analysis: Dow Nears All-Time High

Written By
Paul Shread
Paul Shread
May 10, 2006
1 minute read

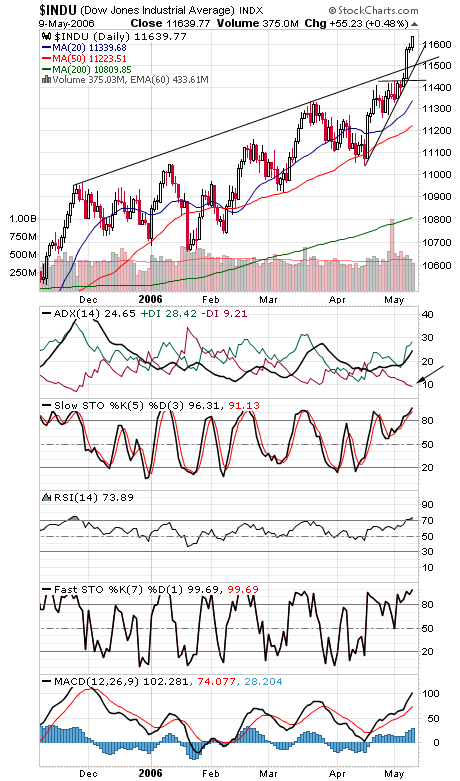
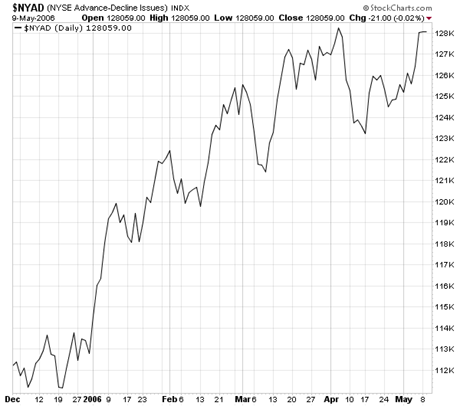
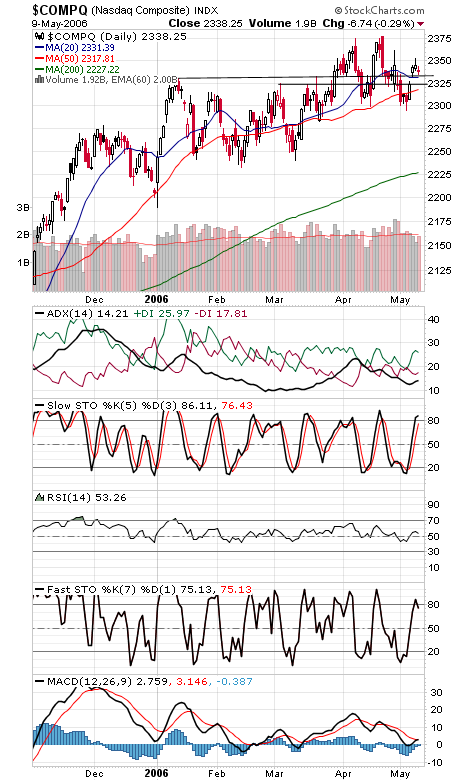
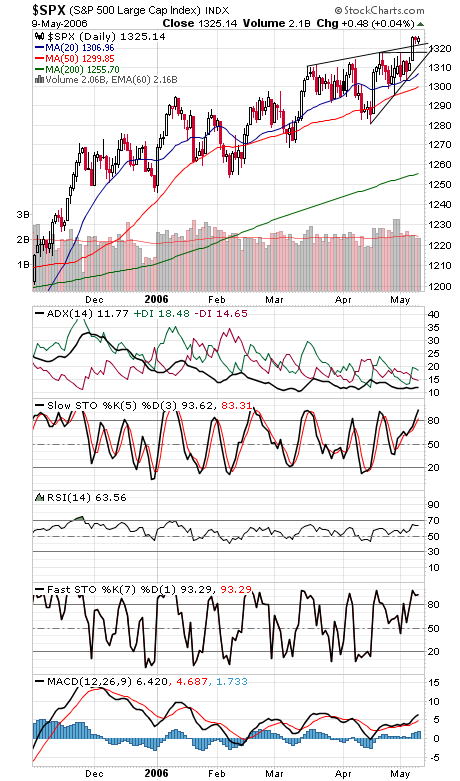
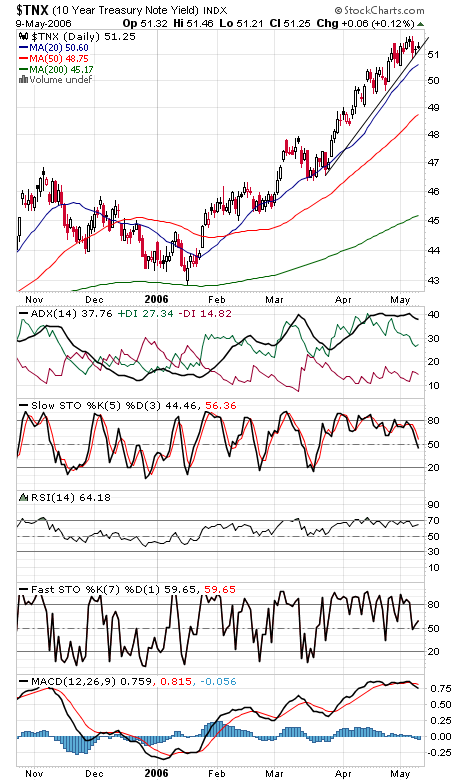
As the Dow (first chart below) nears its all-time high of 11,722-11,750, the NYSE advance-decline line (second chart) remains stuck and the Nasdaq (third chart) is faring even worse. How long can a rally this selective last? One negative in that Dow chart is that -DI, or selling pressure, has completely dried up. When we saw that back in March, the index corrected nearly 300 points. Support on the Dow is 11,500 and 11,426. The Nasdaq has support at 2328-2333, 2325, 2318 and 2290-2300. Resistance is 2350-2354, 2362 and 2375-2380. The S&P (fourth chart) faces a band of resistance from 1325-1350, and 1322 and 1315-1318 are support. Long bond yields (fifth chart) are struggling here; what will tomorrow’s Fed statement bring?


Internet News Logo

InternetNews is a source of industry news and intelligence for IT professionals from all branches of the technology world. InternetNews focuses on helping professionals grow their knowledge base and authority in their field with the top news and trends in Software, IT Management, Networking & Communications, and Small Business.

Property of TechnologyAdvice. © 2026 TechnologyAdvice. All Rights Reserved

Advertiser Disclosure: Some of the products that appear on this site are from companies from which TechnologyAdvice receives compensation. This compensation may impact how and where products appear on this site including, for example, the order in which they appear. TechnologyAdvice does not include all companies or all types of products available in the marketplace.