Technical Analysis: Dow Nears Historic High | Internet News

Technical Analysis: Dow Nears Historic High

Written By
Paul Shread
Paul Shread
Sep 27, 2006
1 minute read

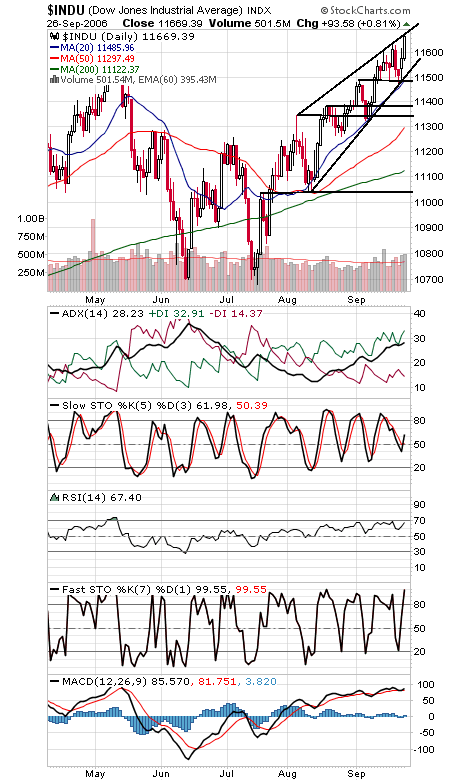
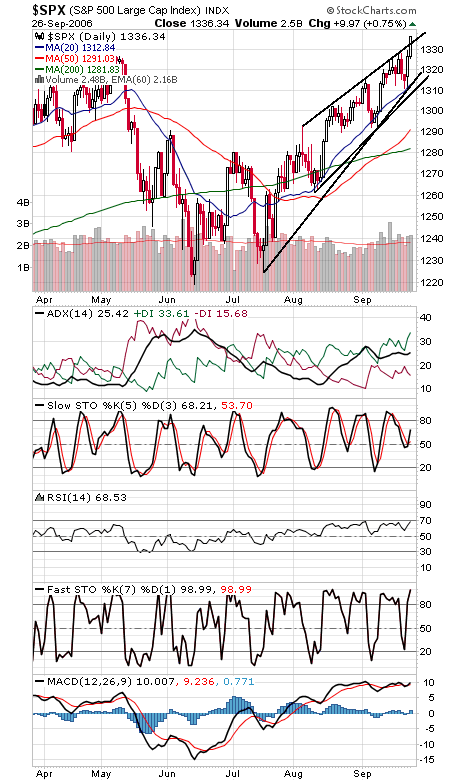
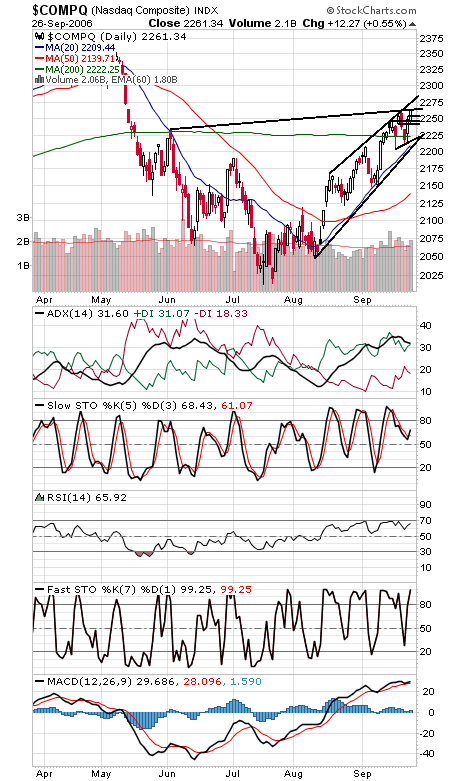
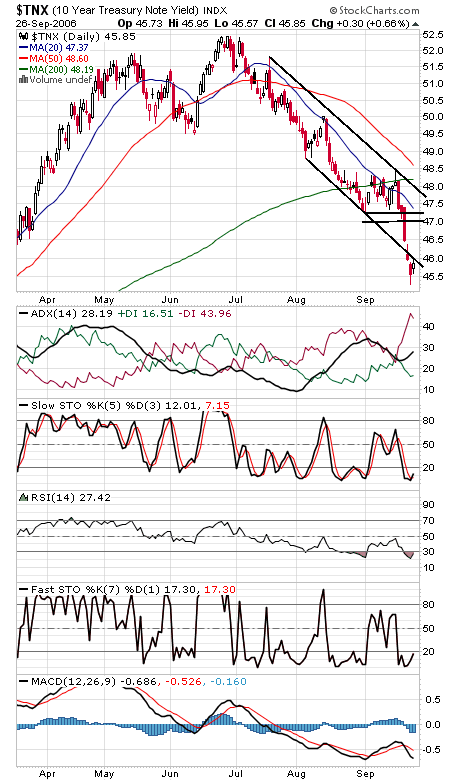
The Dow (first chart below) continues to be drawn to its all-time high of 11,722-11,750, and its ability to press that level in what has historically been the weakest month of the year is impressive. That said, internals have been unimpressive and the rally has been overlapping, with each new high overlapped on a subsequent pullback — that’s not usually a sign of lasting strength. But the trend remains up until proven otherwise. Critical support on the Dow is 11,480-11,520. The S&P (second chart) took out rising resistance today, another show of strength by the bulls. Next up is 1340-1342, and support is 1334, 1330 and 1326-1327. The Nasdaq (third chart) was the laggard today, ending the day at 2262 resistance. Support is 2253, 2250 and 2243. Bond yields (fourth chart) finally gave back a little today on rising consumer confidence.


Internet News Logo

InternetNews is a source of industry news and intelligence for IT professionals from all branches of the technology world. InternetNews focuses on helping professionals grow their knowledge base and authority in their field with the top news and trends in Software, IT Management, Networking & Communications, and Small Business.

Property of TechnologyAdvice. © 2026 TechnologyAdvice. All Rights Reserved

Advertiser Disclosure: Some of the products that appear on this site are from companies from which TechnologyAdvice receives compensation. This compensation may impact how and where products appear on this site including, for example, the order in which they appear. TechnologyAdvice does not include all companies or all types of products available in the marketplace.