Technical Analysis: Dow, S&P Hang On | Internet News

Technical Analysis: Dow, S&P Hang On

Written By
Paul Shread
Paul Shread
Sep 7, 2006
1 minute read


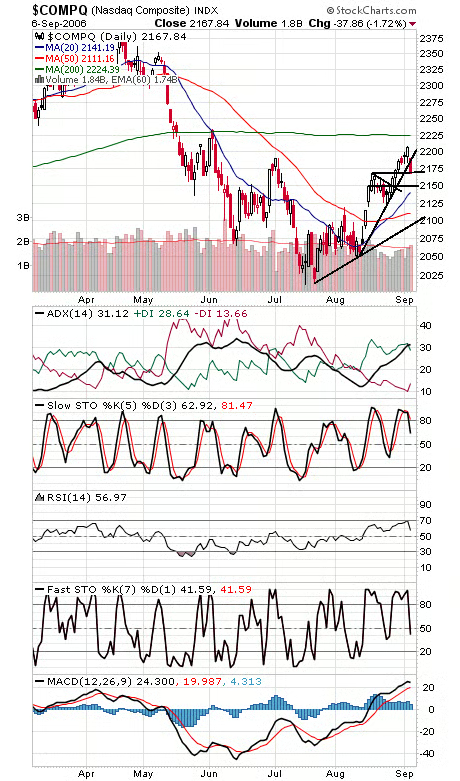
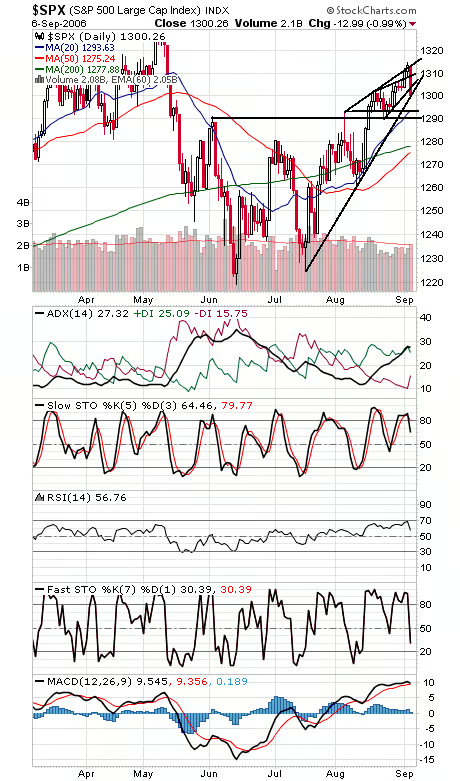
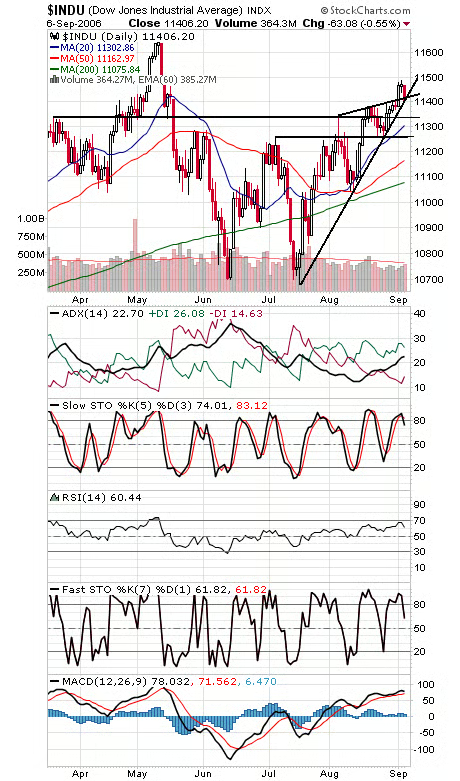
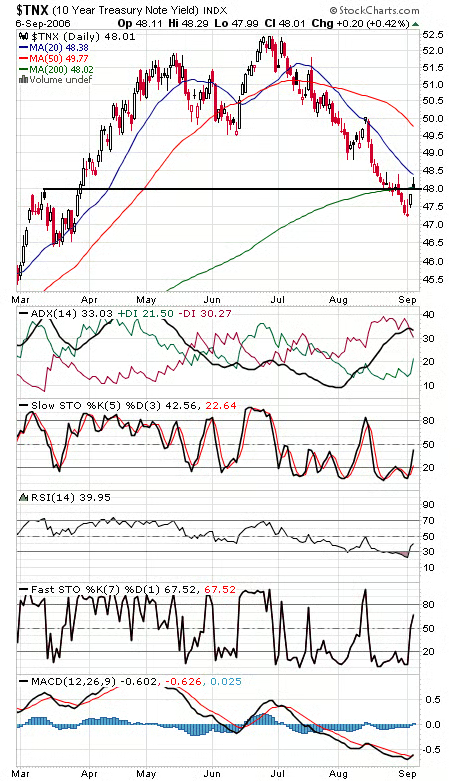
The Nasdaq (first chart below) gave up its August uptrend line today. 2150 looks like the next solid support, and 2195 is resistance. The Dow and S&P (second and third charts) find themselves right on critical support after giving up the breakouts of the last two days. One problem with rising resistance (and falling support) is that the energy it takes to break through it can exhaust the trend, creating what some refer to as a “throwever,” a last thrust before reversal. The indexes could be starting a “C” wave down here to complete the correction begun in May. The S&P faces resistance at 1302, 1306 and 1310, and next support levels are 1293 and 1290. The Dow’s next support levels are 11,330 and 11,250, and first resistance is 11,420-11,430. Bond yields (fourth chart) closed right on resistance today.


Internet News Logo

InternetNews is a source of industry news and intelligence for IT professionals from all branches of the technology world. InternetNews focuses on helping professionals grow their knowledge base and authority in their field with the top news and trends in Software, IT Management, Networking & Communications, and Small Business.

Property of TechnologyAdvice. © 2026 TechnologyAdvice. All Rights Reserved

Advertiser Disclosure: Some of the products that appear on this site are from companies from which TechnologyAdvice receives compensation. This compensation may impact how and where products appear on this site including, for example, the order in which they appear. TechnologyAdvice does not include all companies or all types of products available in the marketplace.