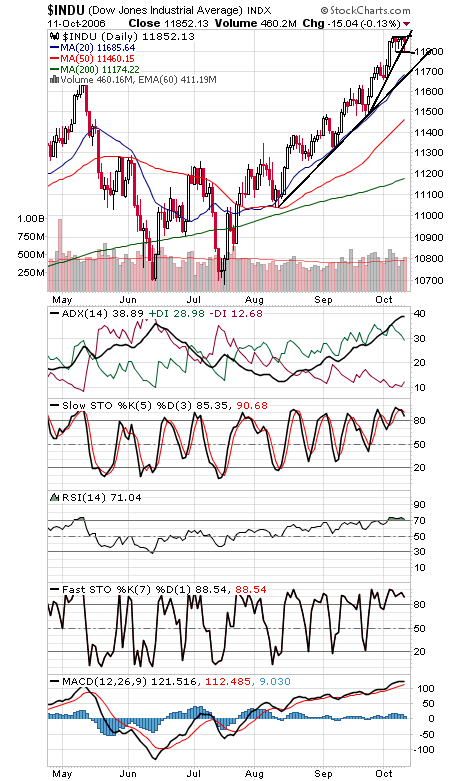
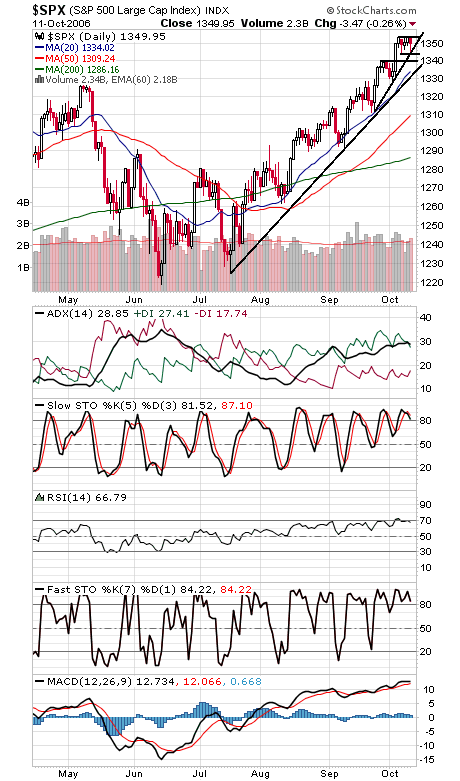
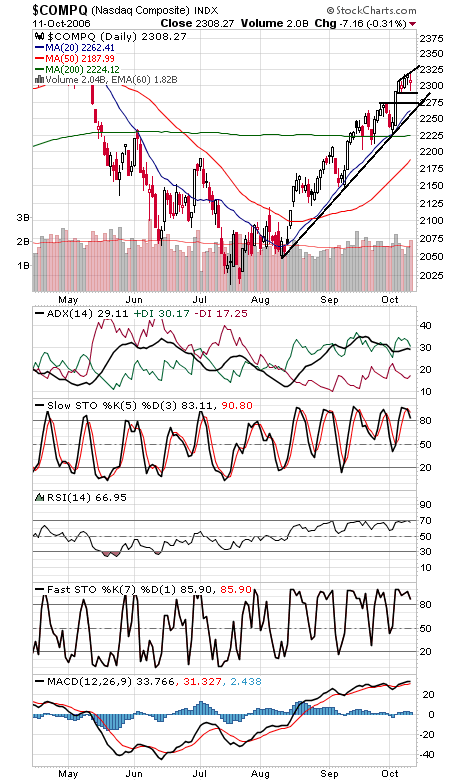
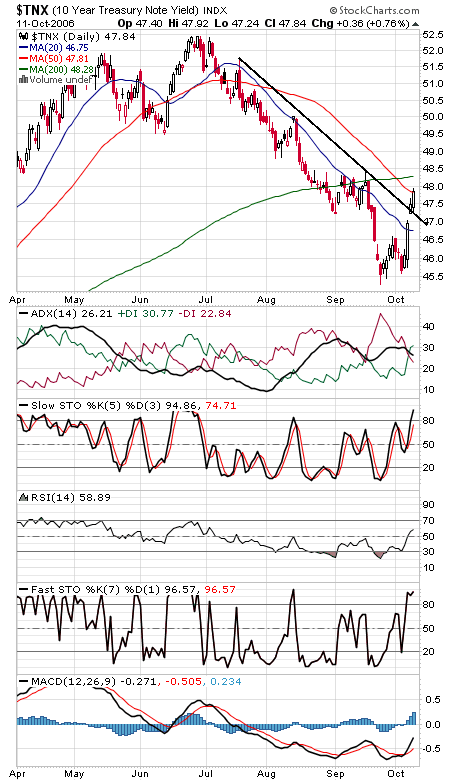
The Dow and S&P (first two charts below) continue to wind up in a very tight range here. Since the consolidation is occurring at a high after an uptrend, odds favor that the patterns will resolve to the upside, but keep an eye on the bottom of the short-term ranges in case the market has other ideas. The Dow’s range is roughly 11,800-11,880; a break either way should yield an 80-point move. 11,722-11,750 and 11,690 are important support levels. The S&P remains stuck between 1344 and 1354, and a 10-point move should result from a breakout of that range. 1361 and 1376-1389 are important levels to the upside, and 1340 and 1333 to the downside, with 1347 as first support. The Nasdaq (third chart) has support at 2290, 2275 and 2262, and resistance is 2325-2333. Bond traders (fourth chart) began pricing out another Fed rate cut today. That will get stock traders’ attention at some point. Some big moving averages coming up for the TNX, though.