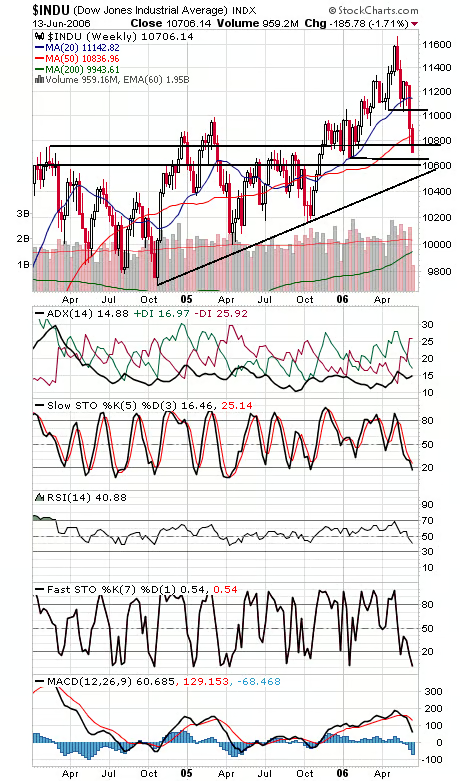
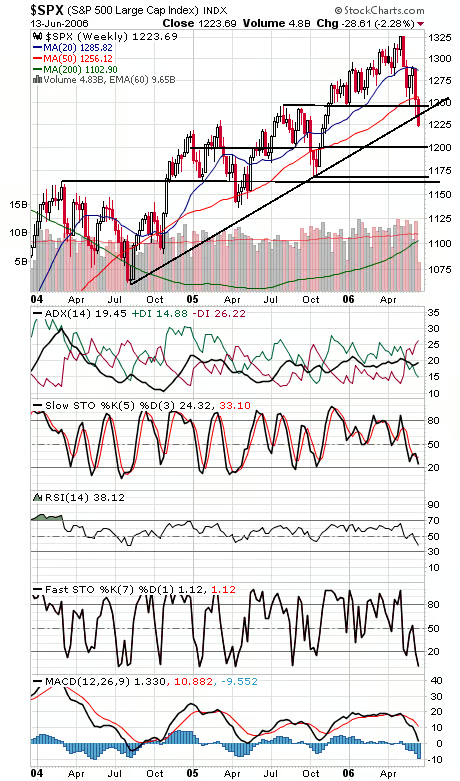
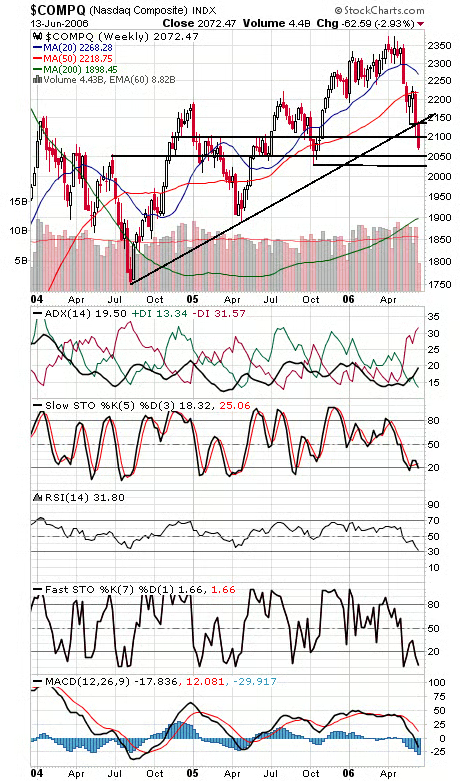
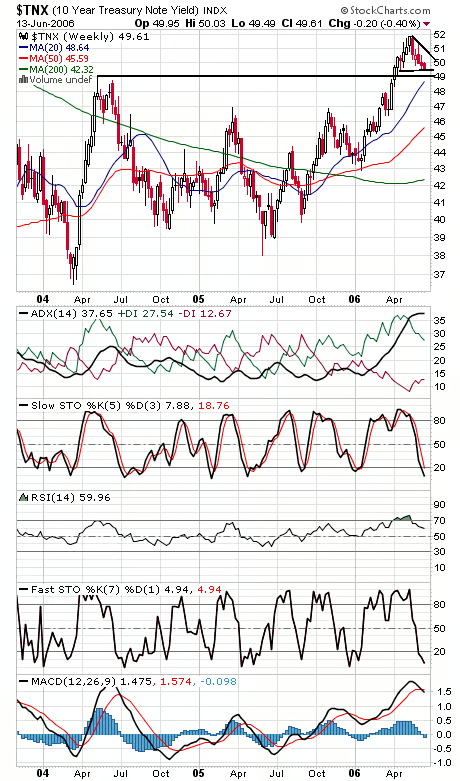
The indexes continue straight down without so much as a bounce, slicing through support levels with ease. So where will it stop? At this point, due to the intensity of the selling, the best plan may be to wait for a day of intense buying, a 90% upside day that suggests that investors are finally having second thoughts about selling. Until then, standing aside may be the best option. Still, at some point the indexes will be due for a good bounce. The Dow (first chart below) has its next support levels at 10,661, 10,600 and 10,500, and resistance is 10,754-10,757, 10,837 and 10,880. The S&P (second chart) has its next support level at 1200, with 1165-1170 below that. 1230-1235 and 1245 are now resistance. The Nasdaq (third chart) has important support levels at 2050, 2025 and the big round number of 2000, and resistance is 2100, 2125-2130 and 2140. Not much new with long bond yields (fourth chart); still creeping lower, but no big breaks yet.