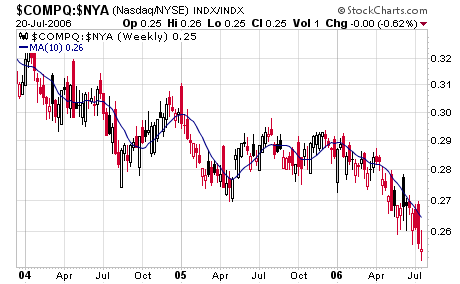
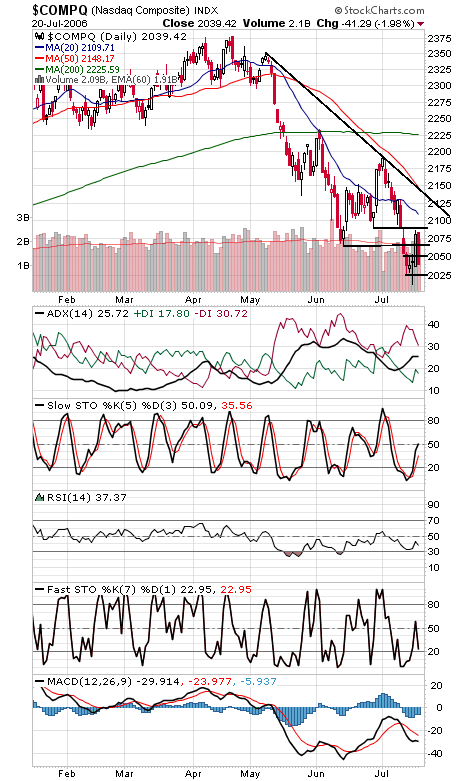
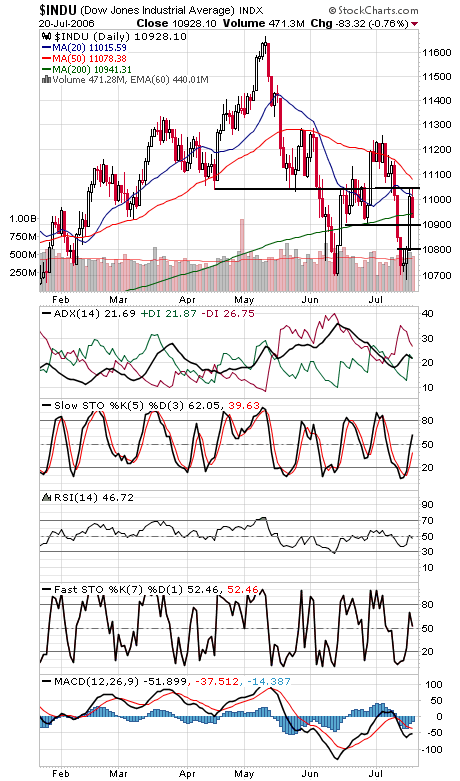
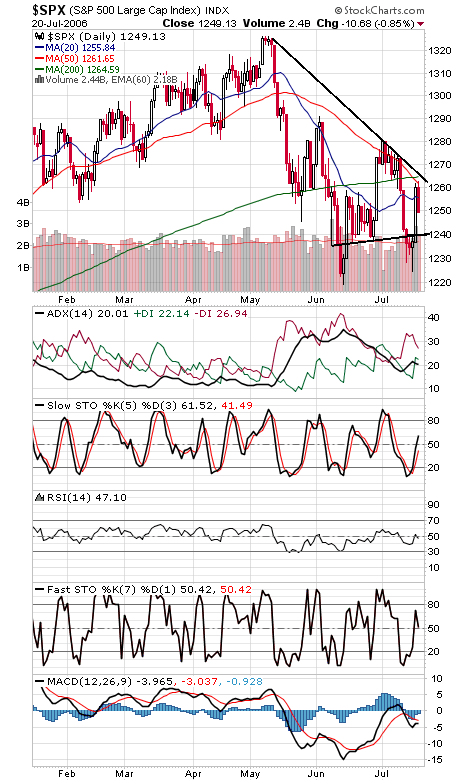
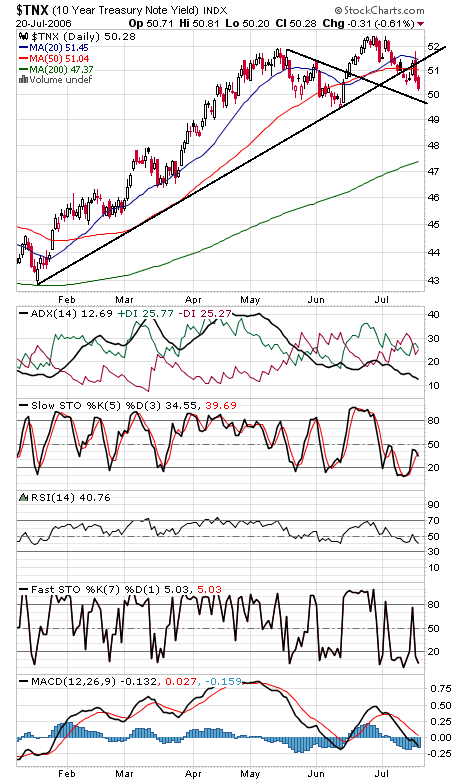
It’s been a while since we ran a chart of Gerald Appel’s 10-week Nasdaq/NYSE relative strength indicator (first chart below), and it’s worth running now only because the Nasdaq’s underperformance has worsened rather than improved. At some point, the tech sector will begin to outperform again, but that has yet to happen, and in the meantime, the techs are threatening to undo lingering hopes for a summer rally. And since the techs lead more than they lag, continued underperformance could have implications for the market as a whole. The Nasdaq (second chart) continues to press the critical 2000-2025 support zone; if that goes, 1850-1900 could be the next target. To the upside, 2050 is now first resistance again, with 2065 and 2090-2100 above that. The Dow (third chart) failed at 11,040 resistance today and then closed back below its 200-day average. 10,900 and 10,800 are the next support levels. The S&P (fourth chart) faces a cluster of resistance at 1260-1265, and support is 1245 and 1240. Long bond yields (fifth chart) continue to smell a slowdown here.