Technical Analysis: Nasdaq Ends Week At Resistance | Internet News

Technical Analysis: Nasdaq Ends Week At Resistance

Written By
Paul Shread
Paul Shread
Feb 25, 2006
1 minute read

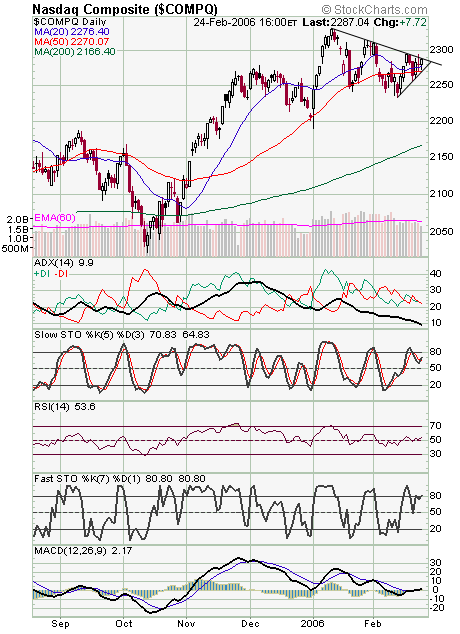
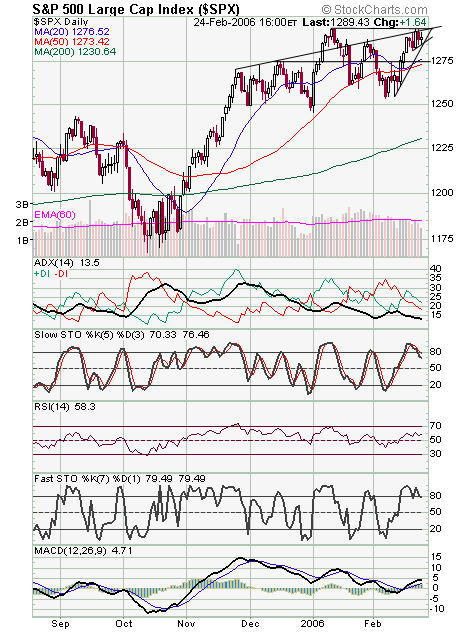
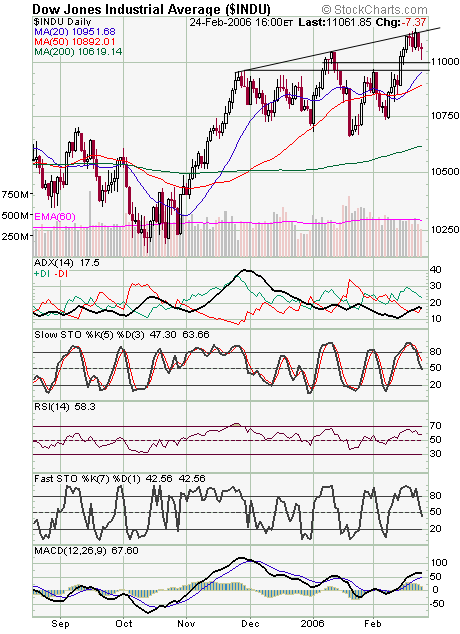
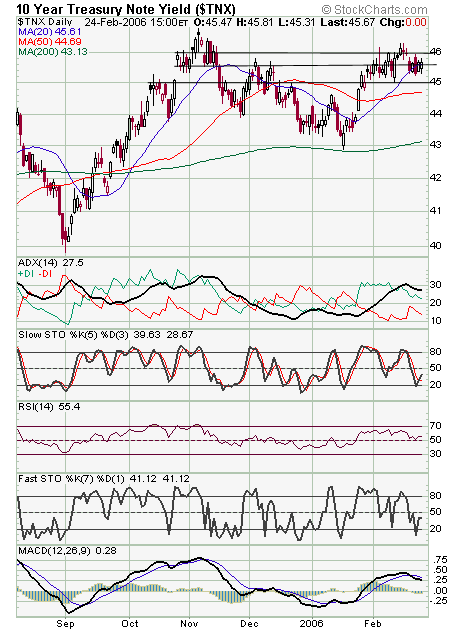
The Nasdaq (first chart below) ended the week right at its downtrend line; a nice recovery for the index after yesterday’s failed breakout. Almost any move up Monday could give the index room to run, while support is 2270-2273. The S&P (second chart) put in an “inside day,” reflecting indecision, at the major resistance level of 1295. Support is 1285-1286, 1282 and 1274-1275. The Dow (third chart) has begun to lag the last couple of days. Resistance is 11,150 and 11,200, and support is 11,050, 11,000 and 10,960. Longs bonds (fourth chart) continue to remain undecided here; five straight days in a narrow range.


Internet News Logo

InternetNews is a source of industry news and intelligence for IT professionals from all branches of the technology world. InternetNews focuses on helping professionals grow their knowledge base and authority in their field with the top news and trends in Software, IT Management, Networking & Communications, and Small Business.

Property of TechnologyAdvice. © 2026 TechnologyAdvice. All Rights Reserved

Advertiser Disclosure: Some of the products that appear on this site are from companies from which TechnologyAdvice receives compensation. This compensation may impact how and where products appear on this site including, for example, the order in which they appear. TechnologyAdvice does not include all companies or all types of products available in the marketplace.