Technical Analysis: Nasdaq, S&P Push Resistance | Internet News

Technical Analysis: Nasdaq, S&P Push Resistance

Written By
Paul Shread
Paul Shread
Feb 17, 2006
1 minute read


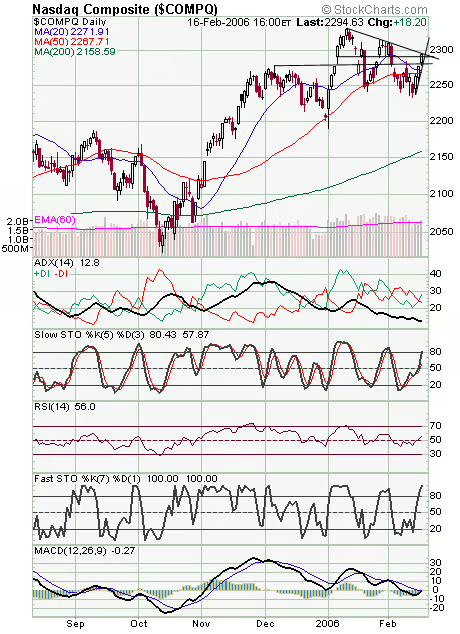
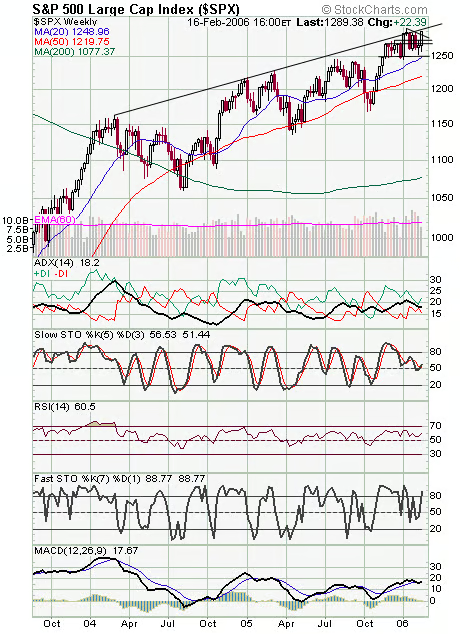
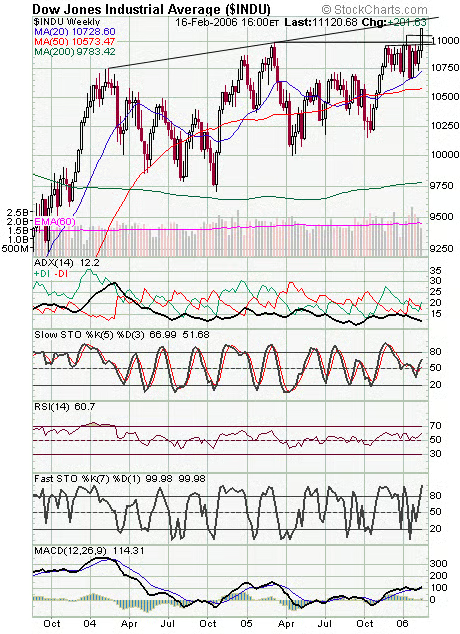
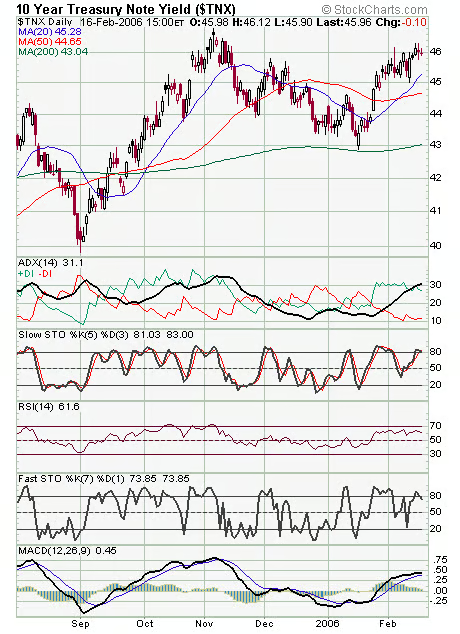
The Nasdaq (first chart below) is pushing its month-long downtrend line here. Resistance is 2295-2300, and support is 2290, 2285 and 2280. The S&P (second chart) faces major resistance at 1293-1295, and support is 1285, 1275 and 1270. The Dow (third chart) has another 60-70 points of upside before it hits major resistance. Support is 11,050-11,070, 11,000 and 10,960. Long bonds (fourth chart) remain undecided about their next move.


Internet News Logo

InternetNews is a source of industry news and intelligence for IT professionals from all branches of the technology world. InternetNews focuses on helping professionals grow their knowledge base and authority in their field with the top news and trends in Software, IT Management, Networking & Communications, and Small Business.

Property of TechnologyAdvice. © 2026 TechnologyAdvice. All Rights Reserved

Advertiser Disclosure: Some of the products that appear on this site are from companies from which TechnologyAdvice receives compensation. This compensation may impact how and where products appear on this site including, for example, the order in which they appear. TechnologyAdvice does not include all companies or all types of products available in the marketplace.