Technical Analysis: New Highs | Internet News

Technical Analysis: New Highs

Written By
Paul Shread
Paul Shread
Dec 5, 2006
1 minute read

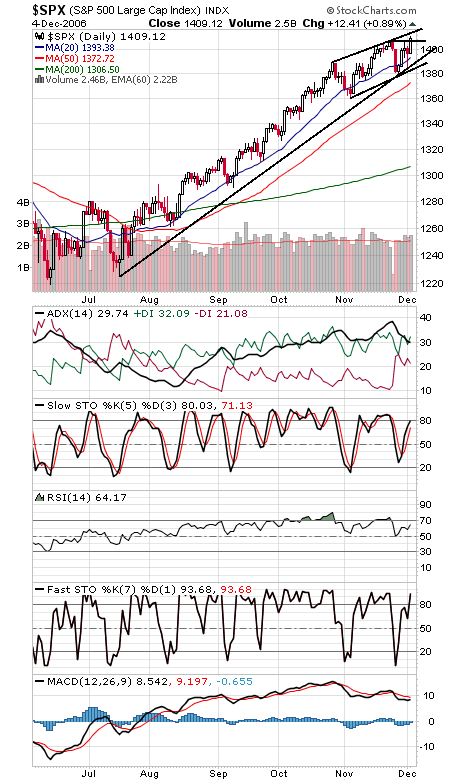
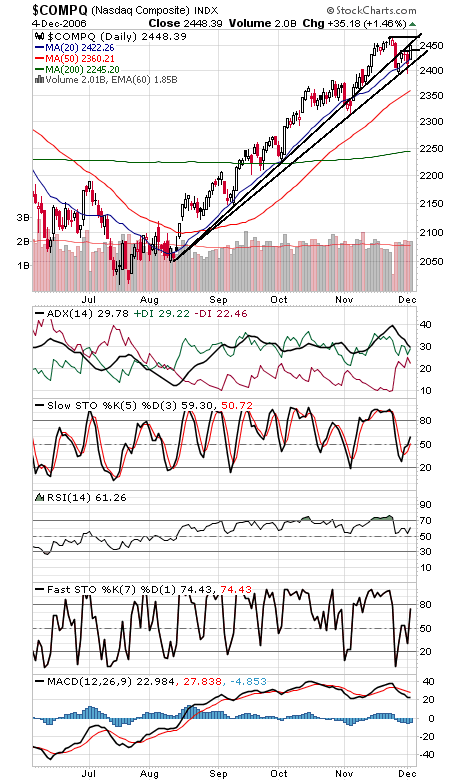
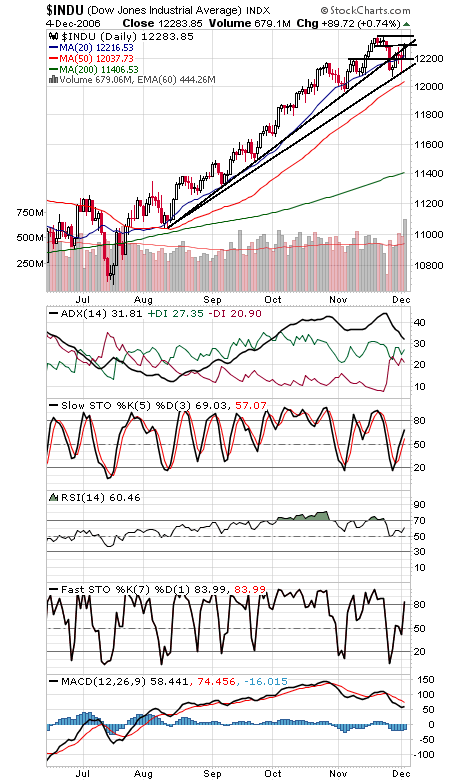
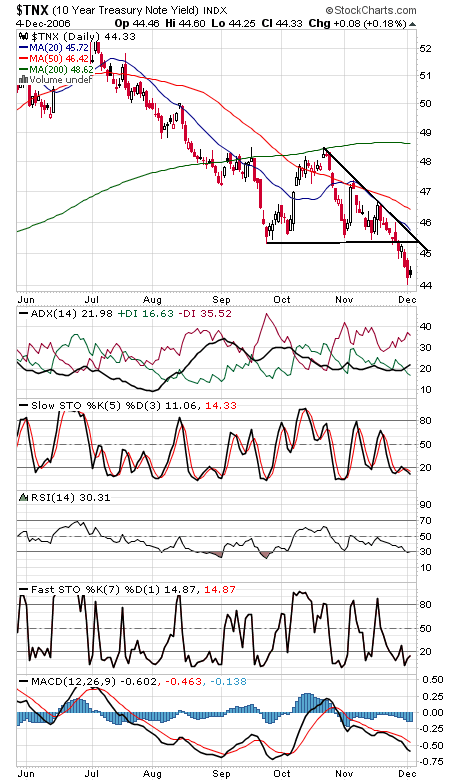
A new high for the S&P (first chart below) suggests that another mini-correction might be over, as monthly inflows appear to have saved the market once again. You could make a living trading just around the first of the month, as Norm Fosback pointed out 30 years ago. First resistance on the big caps is 1414-1415, and it appears to be a level of some importance — the index’s rate of ascent could be slowing down if the rally is stymied there, witness the potential channel forming since late October. Support on the index is 1408, 1400, 1390 and 1385. The Nasdaq (second chart) faces resistance at 2455-2460 and 2468, and support is 2440 and 2420. The Dow (third chart) faces resistance at 12,310 and 12,355, and support is 12,200 and 12,125. Long bond yields (fourth chart) took a well deserved breather today.


Internet News Logo

InternetNews is a source of industry news and intelligence for IT professionals from all branches of the technology world. InternetNews focuses on helping professionals grow their knowledge base and authority in their field with the top news and trends in Software, IT Management, Networking & Communications, and Small Business.

Property of TechnologyAdvice. © 2026 TechnologyAdvice. All Rights Reserved

Advertiser Disclosure: Some of the products that appear on this site are from companies from which TechnologyAdvice receives compensation. This compensation may impact how and where products appear on this site including, for example, the order in which they appear. TechnologyAdvice does not include all companies or all types of products available in the marketplace.