Technical Analysis: Outside Days | Internet News

Technical Analysis: Outside Days

Written By
Paul Shread
Paul Shread
Mar 22, 2006
1 minute read

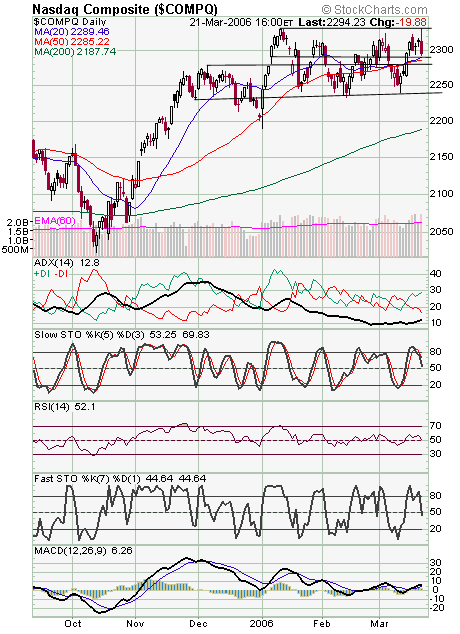
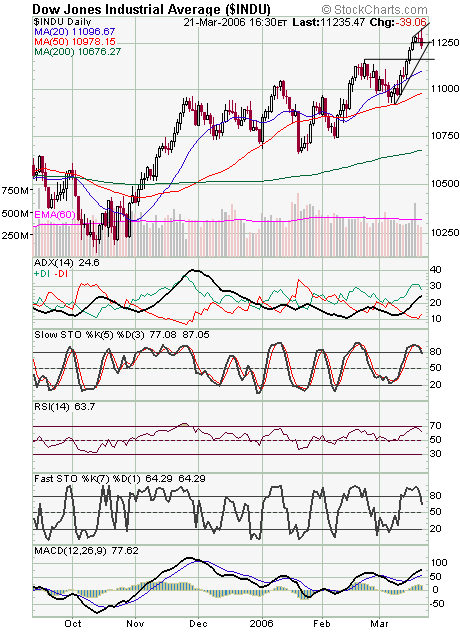
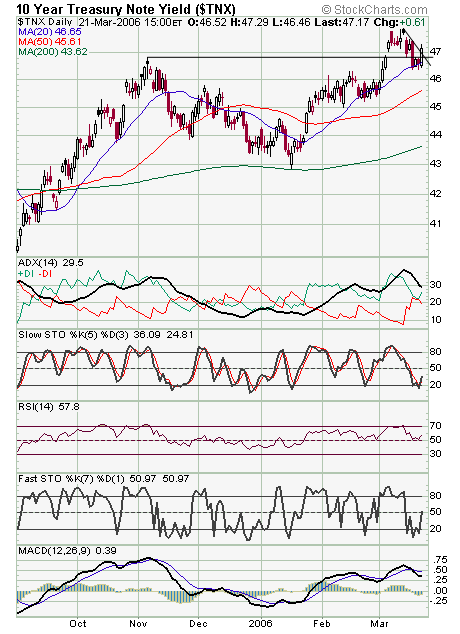
“Outside days” on all the major indexes today, a potential reversal sign. The Nasdaq (first chart below) engulfed the previous four trading days today; we’ll see if sellers have any follow-through on that set-up. The index has lots of support at 2280-2290, and resistance is way up at 2333 after today’s straight-line decline. The S&P (second chart) put in something of a “tri-star” top today, another pattern to keep an eye on. Support is 1295, 1288-1290 and 1283, and resistance is 1300, 1303, 1310 and 1316. The Dow (third chart) has support at 11,220, 11,200 and 11,160, and resistance is 11,250, 11,300 and 11,350-11,426. Long bond yields (fourth chart) just refuse to behave.


Internet News Logo

InternetNews is a source of industry news and intelligence for IT professionals from all branches of the technology world. InternetNews focuses on helping professionals grow their knowledge base and authority in their field with the top news and trends in Software, IT Management, Networking & Communications, and Small Business.

Property of TechnologyAdvice. © 2026 TechnologyAdvice. All Rights Reserved

Advertiser Disclosure: Some of the products that appear on this site are from companies from which TechnologyAdvice receives compensation. This compensation may impact how and where products appear on this site including, for example, the order in which they appear. TechnologyAdvice does not include all companies or all types of products available in the marketplace.