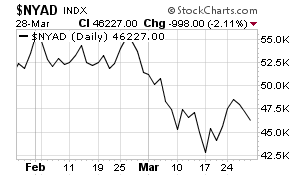
Stocks have given back much of their recent gains, but bears don’t seem to have seized control just yet. For starters, downside volume has been tame, below 80%, and the advance-decline line (first chart below) hasn’t turned sharply lower either. But we’re still waiting for stocks to break out of their two-month trading range.
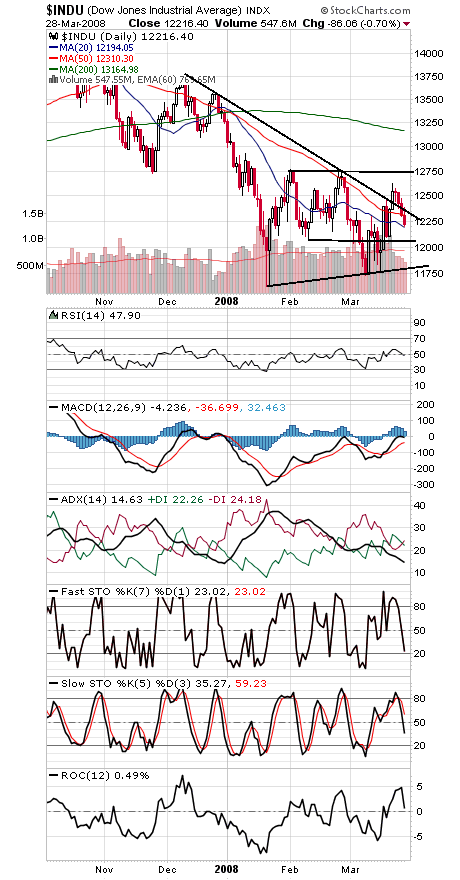
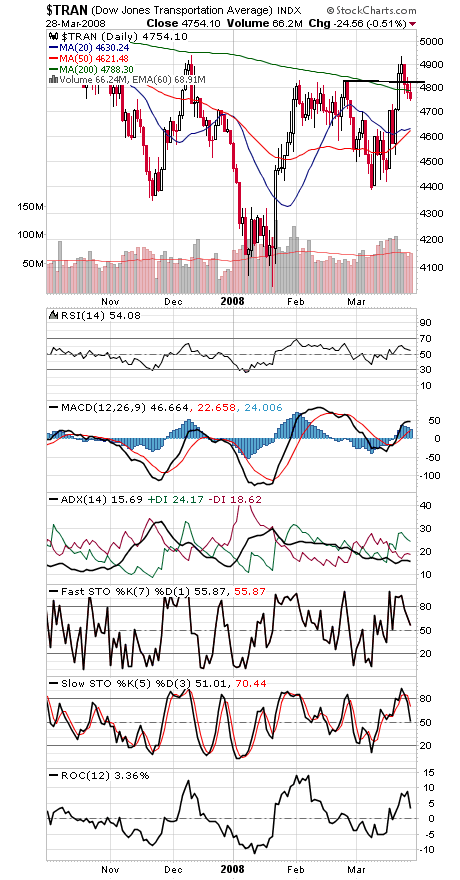
12,743 on the Dow (second chart) remains the big hurdle for the bulls. A close above that level would confirm the Transports (third chart) in a Dow Theory bull signal, reversing November’s bear signal. 12,100 is first support on the Dow, and 12,250-12,300 first resistance.
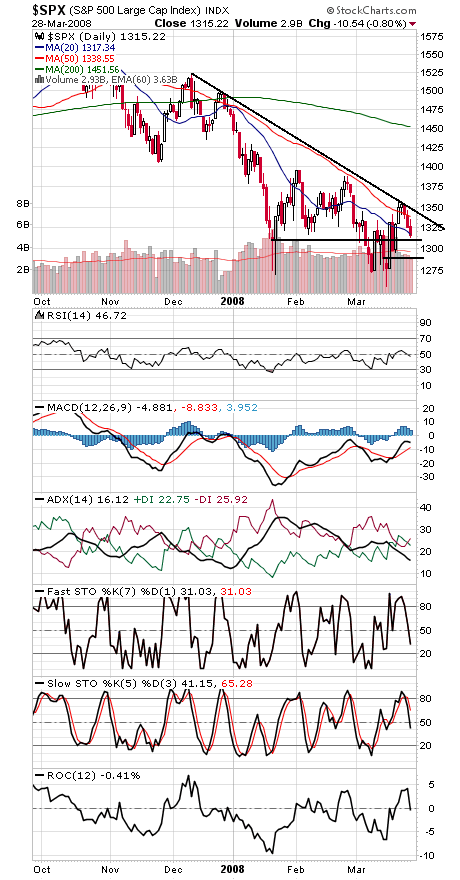
The S&P (fourth chart) needs to clear 1338, 1345, 1370-1380 and 1400-1406, and 1310, 1300 and 1287 are support.
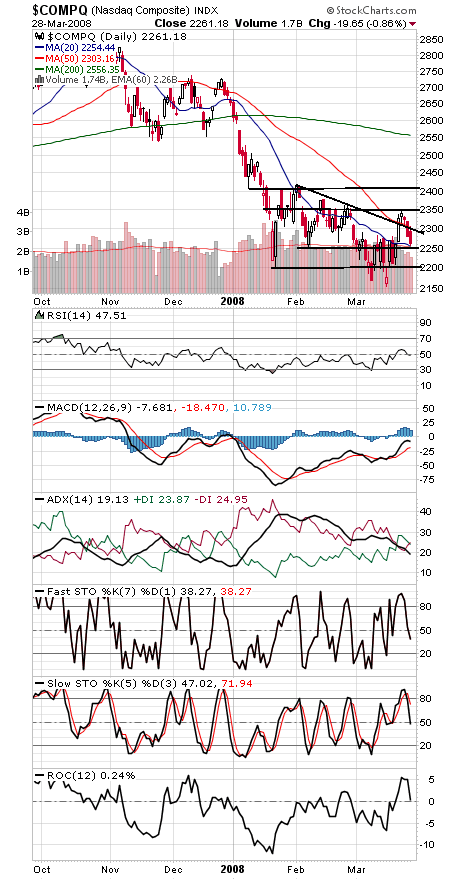
The Nasdaq (fifth chart) faces upside hurdles at 2300, 2350 and 2387-2419, and support is 2250 and 2200-2221.
Paul Shread is a Chartered Market Technician (CMT) and member of the Market Technicians Association.