Investors are having some misgivings after last week’s Dow Theory bull signal, but the history of pullbacks after Dow Theory buy signals suggests that any pullback should be relatively shallow — even if it lasts a while.
As we wrote in November, bear signals tend to be followed by a sharp countertrend move (a rally) about two-thirds of the time, but looking at 60 years of Dow Theory bull signals, a sharp pullback has never occurred following a bull signal, at least since World War II (we define ‘sharp’ as appearing that way on a weekly or monthly chart). That doesn’t rule out months of a sideways or modestly lower consolidation, but it does suggest that the next significant move should be up whenever it arrives, if history is any guide.
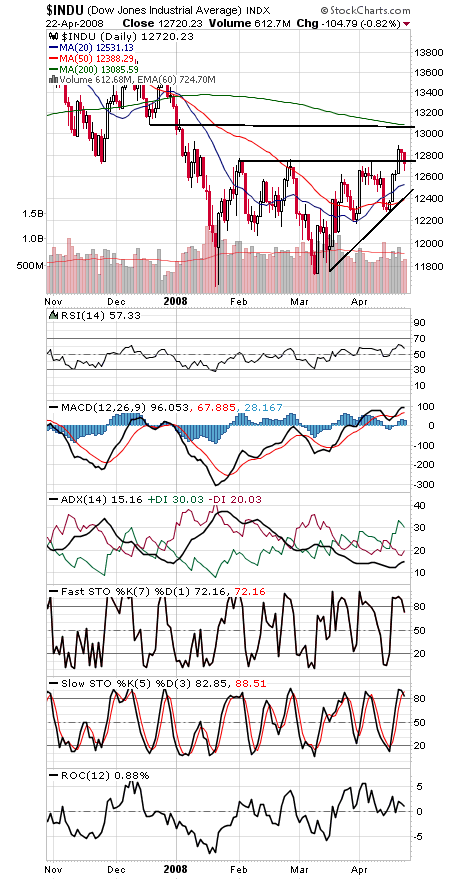
12,450 is strong support on the Dow (first chart below), and 13,100 will be tough resistance.
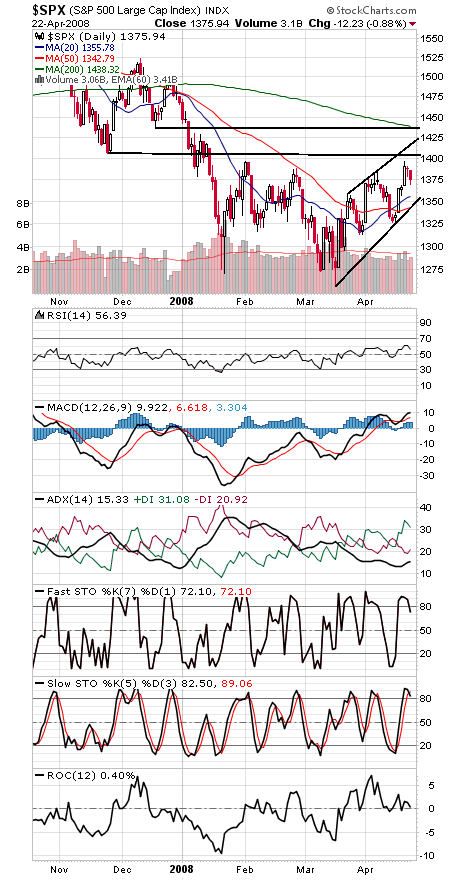
The S&P (second chart) has support at 1350, and 1400-1406 and 1435-1440 are resistance.
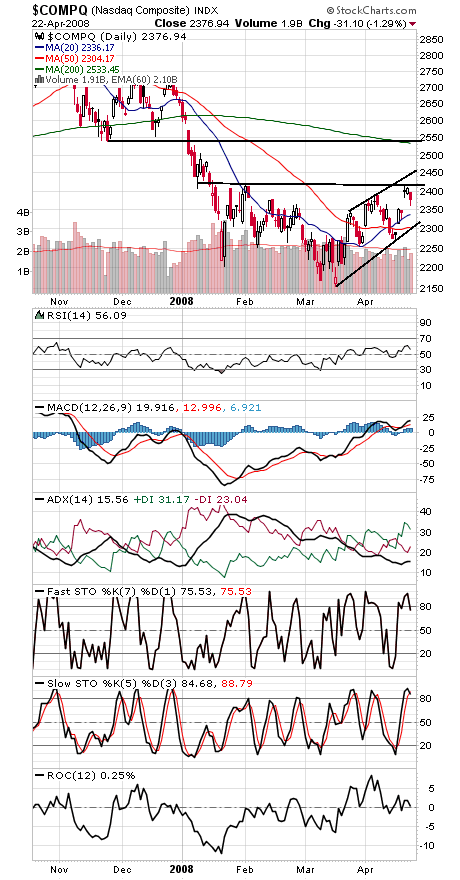
The Nasdaq (third chart) faces resistance at 2419 and 2450, and support is 2350 and 2300.
Paul Shread is a Chartered Market Technician (CMT) and member of the Market Technicians Association.