Technical Analysis: Pullback | Internet News

Technical Analysis: Pullback

Written By
Paul Shread
Paul Shread
Jun 6, 2007
1 minute read

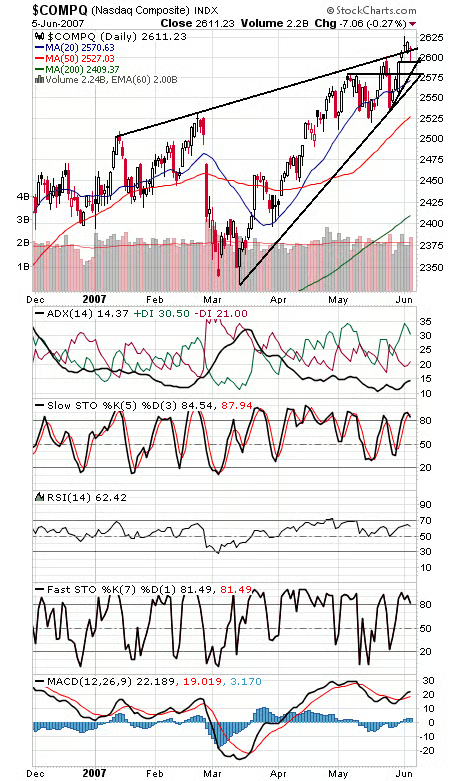
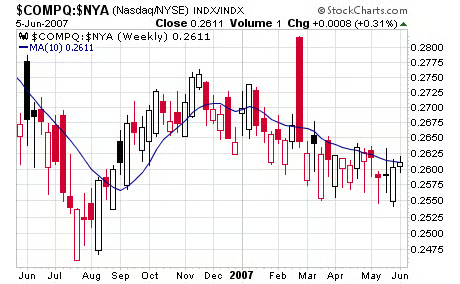
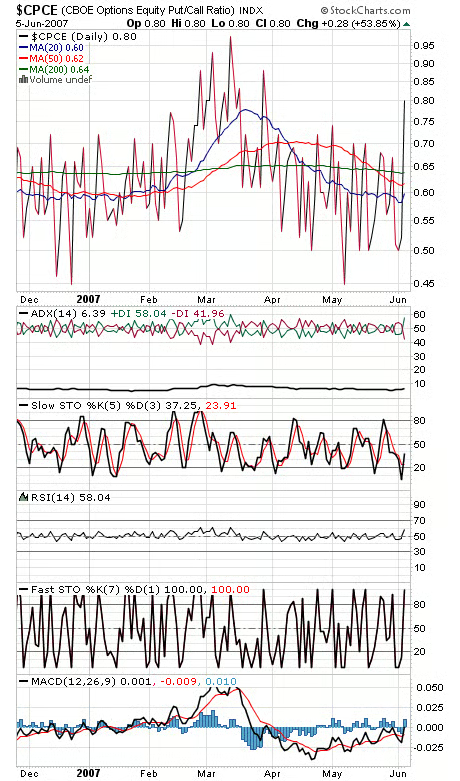
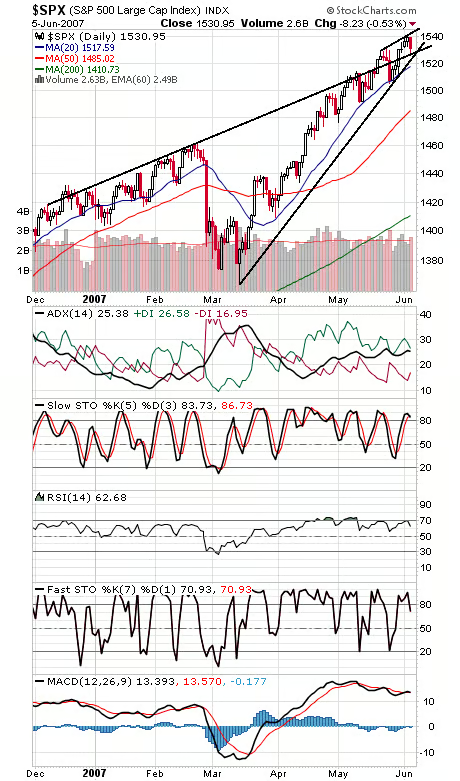
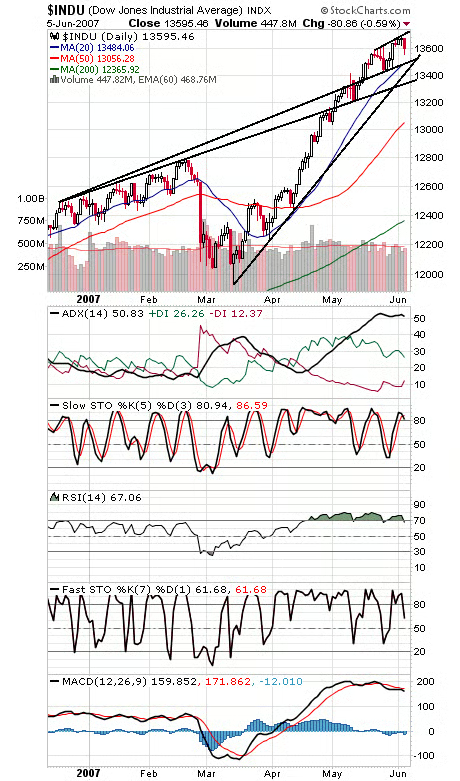
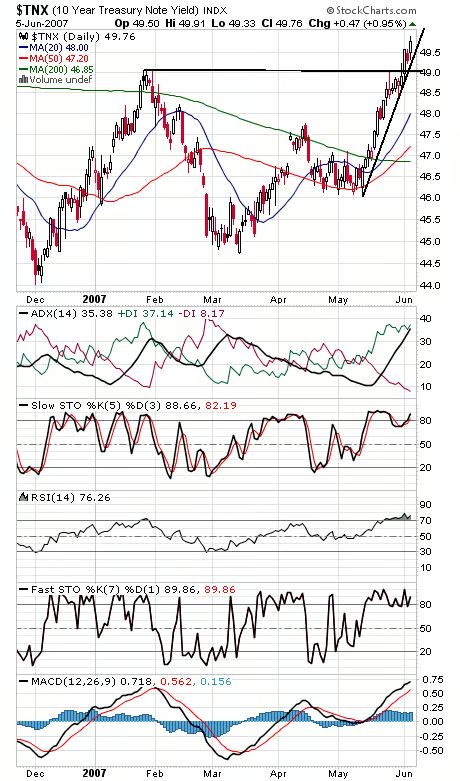
A tough day for the bulls today, and the market will be vulnerable to more like it until it can push through the S&P’s 2000 peak of 1527.46-1552.87 with some conviction. On the plus side, the Nasdaq’s outperformance (first two charts below) has it nearing a buy signal, and we even got a nice little spike in equity put buying today (third chart), hopeful signs that the pullback won’t be too deep. Support on the Nasdaq is 2610, 2600, 2595, 2587, 2581 and 2570, and resistance is 2614, 2618 and 2626. The S&P (fourth chart) has important support at 1525-1527. The Dow (fifth chart) has important support at 13,500, 13,450 and 13,350, and resistance is 13,720. The 10-year yield (sixth chart) continues to push 5% despite looking a little extended.

Paul Shread is a Chartered Market Technician (CMT) and member of the Market Technicians Association

Internet News Logo

InternetNews is a source of industry news and intelligence for IT professionals from all branches of the technology world. InternetNews focuses on helping professionals grow their knowledge base and authority in their field with the top news and trends in Software, IT Management, Networking & Communications, and Small Business.

Property of TechnologyAdvice. © 2026 TechnologyAdvice. All Rights Reserved

Advertiser Disclosure: Some of the products that appear on this site are from companies from which TechnologyAdvice receives compensation. This compensation may impact how and where products appear on this site including, for example, the order in which they appear. TechnologyAdvice does not include all companies or all types of products available in the marketplace.