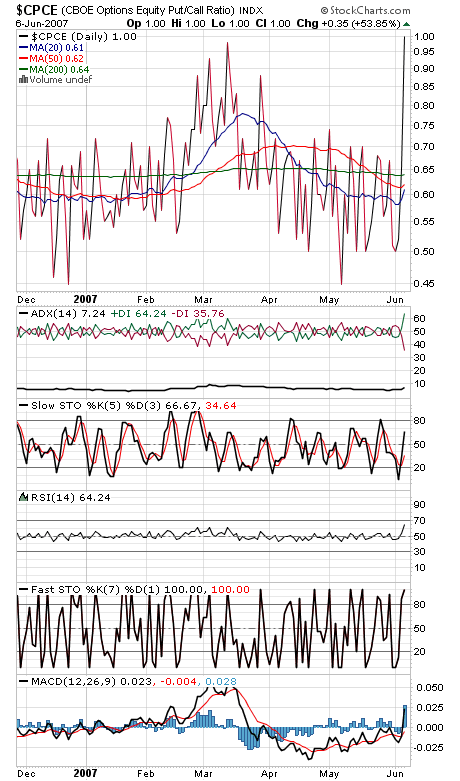
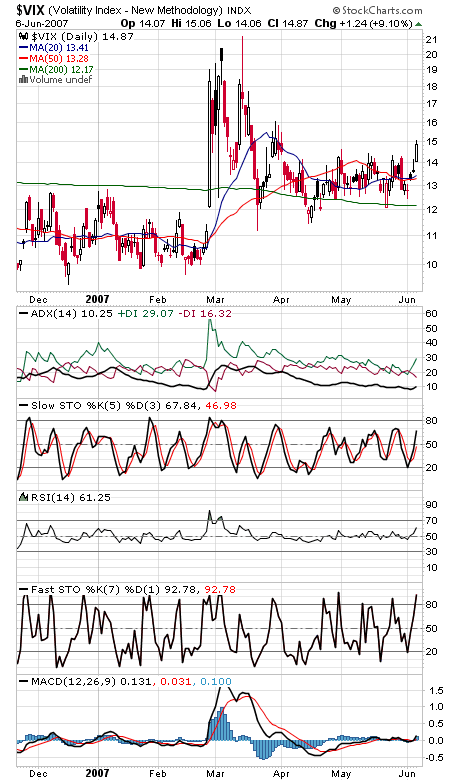
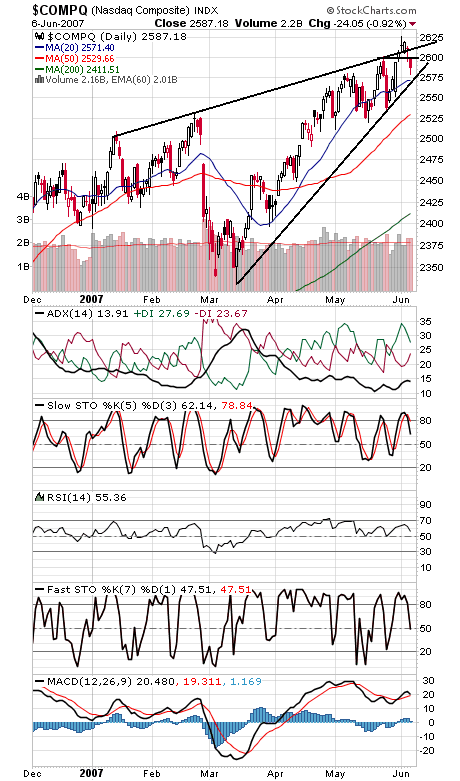
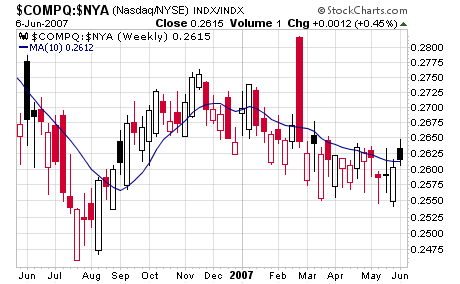
Another rough day for the bulls, but we’d prefer to note the positives here: a nice spike in puts and the volatility index (first two charts below) and the Nasdaq (charts three and four) nearing a buy signal under Gerald Appel’s Nasdaq-NYSE relative strength ratio. Some nice underpinnings that will support the market when it turns, but it may take a few days of bottoming action before that can happen.
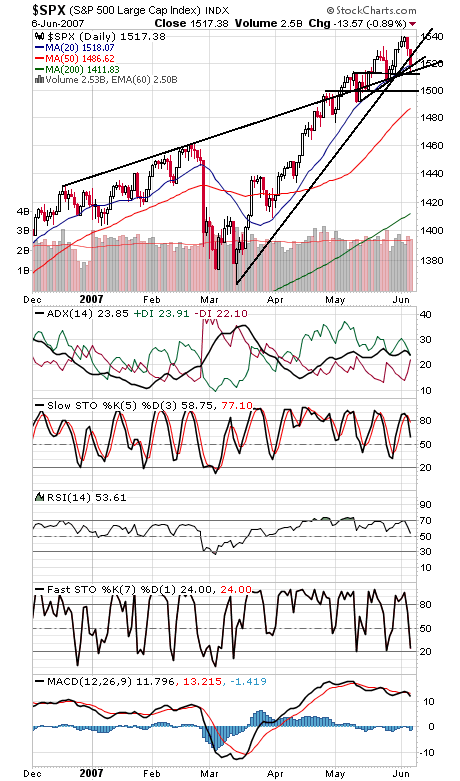
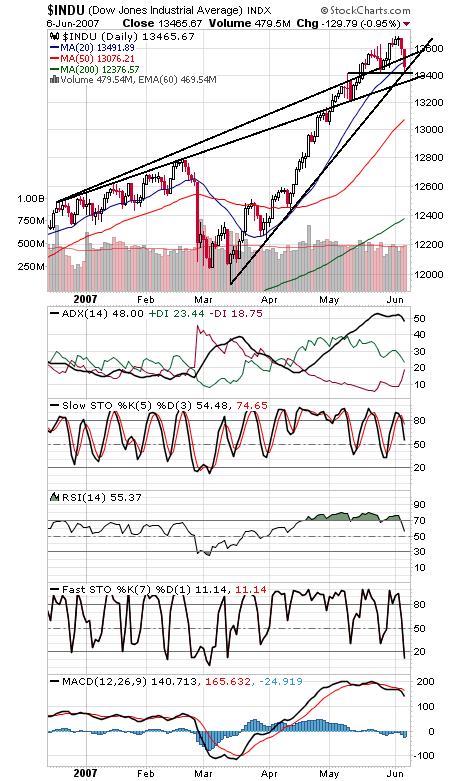
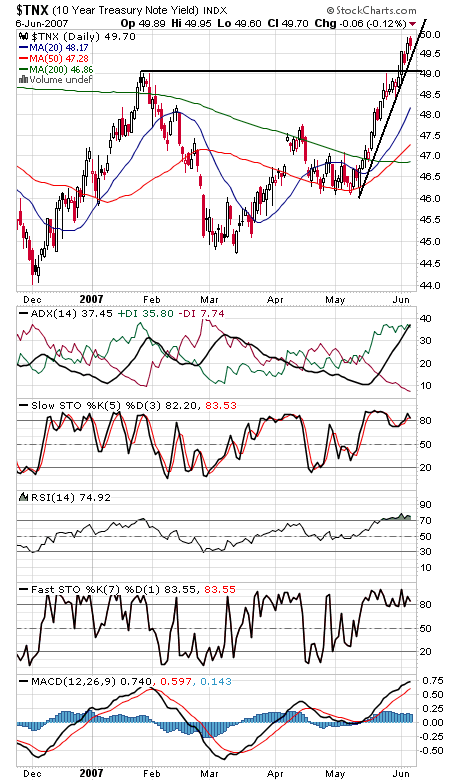
The Nasdaq has support at 2575, and resistance is 2600 and 2611. The S&P (fifth chart) needs to clear its 2000 peak of 1527.46-1552.87 with some conviction; the big hurdle here for the market in general. Below 1512-1514 and the S&P could be headed for 1500, while 1520 and 1527-1530 are first resistance. The Dow (sixth chart) has a whole lot of support between here and 13,350, and first resistance is 13,530. The 10-year yield (seventh chart) stalled today at 5%, a level equity investors also appear to be watching closely.
Paul Shread is a Chartered Market Technician (CMT) and member of the Market Technicians Association