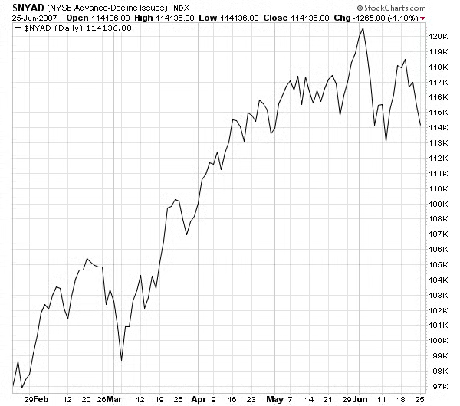
The indexes are retesting their lows here, and with any luck, they won’t have to go much below them, if at all. The NYSE advance-decline line (first chart below) is so far holding above its lows set earlier this month, holding out hope of a positive divergence as the indexes retest their lows. Such strength in the broader market suggests some measure of accumulation here, as does the Nasdaq’s relative outperformance.
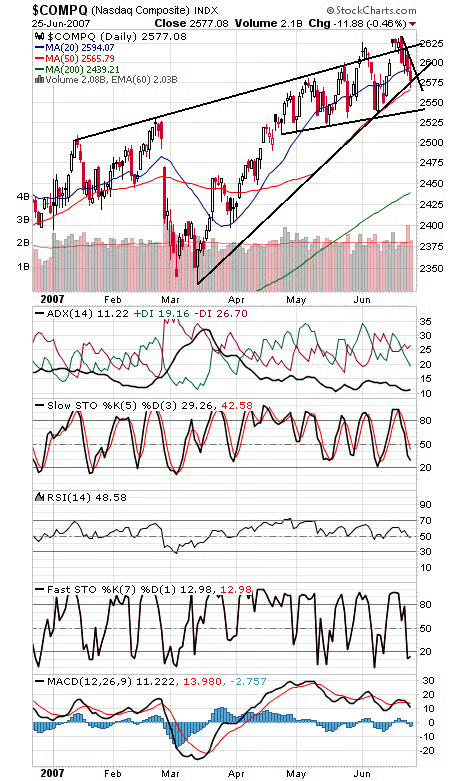
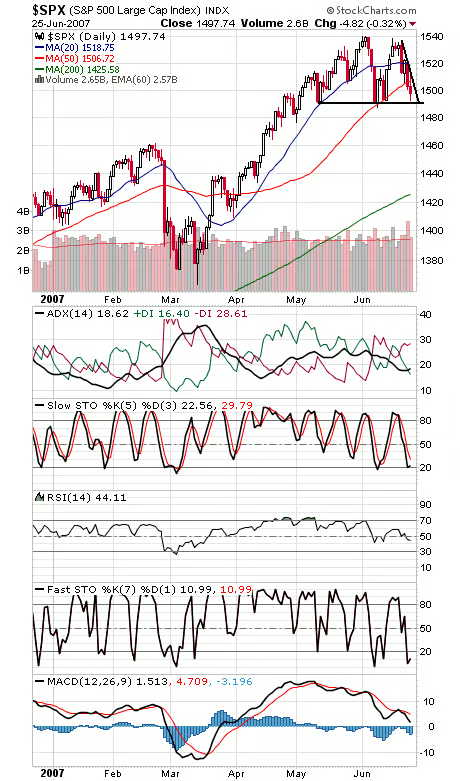
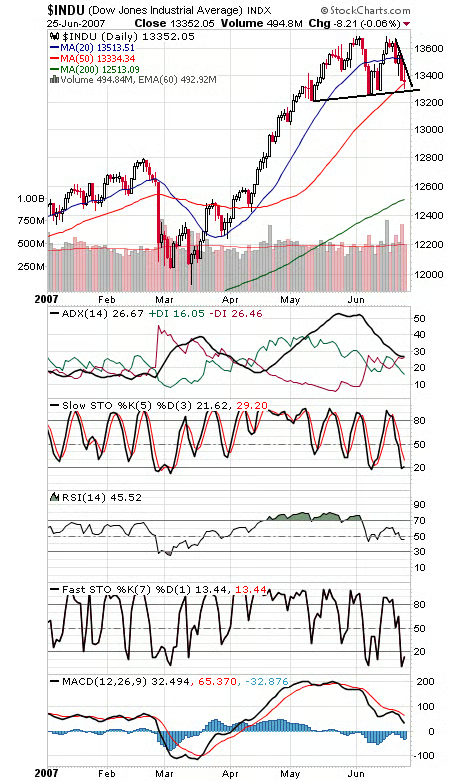
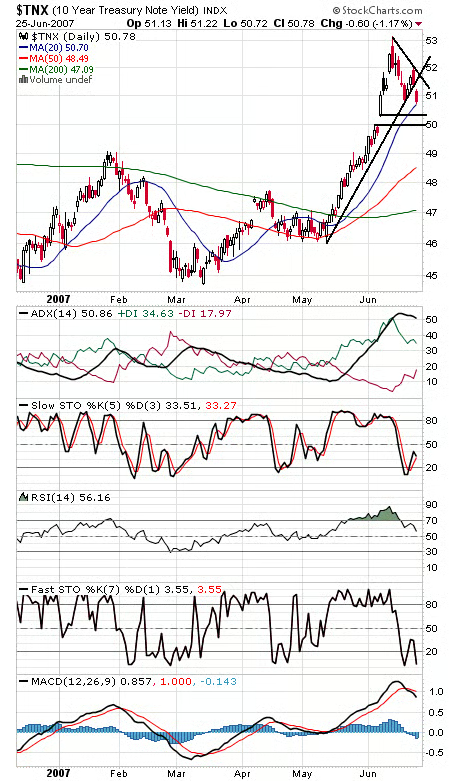
The Nasdaq (chart two) ended the day right on an uptrend line after testing its 50-day average. 2568 is important first support for tomorrow, and 2593 is first resistance. The S&P (third chart) has important support at 1487-1492, and first resistance is 1504-1507. The Dow (fourth chart) has important support at 13,251-13,300, and first resistance is 13,410. A big test for the market in general here. The 10-year yield (sixth chart) is doing its best to support stocks, but it’s coming up on support too.
Paul Shread is a Chartered Market Technician (CMT) and member of the Market Technicians Association