Technical Analysis: Rally Slows | Internet News

Technical Analysis: Rally Slows

Written By
Paul Shread
Paul Shread
Dec 6, 2006
1 minute read

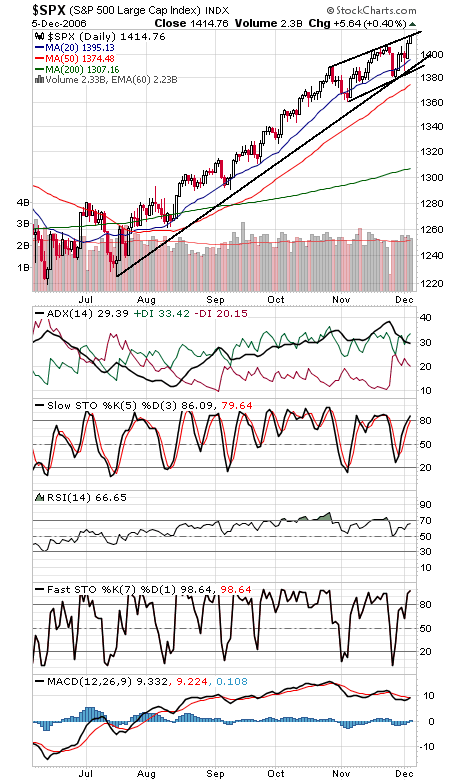
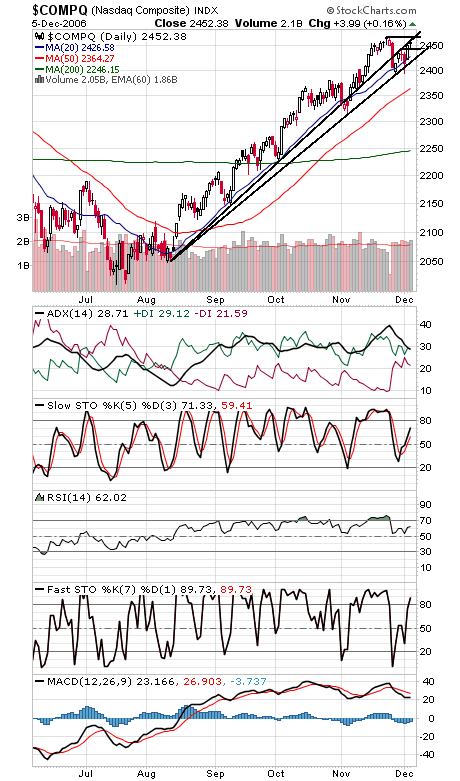
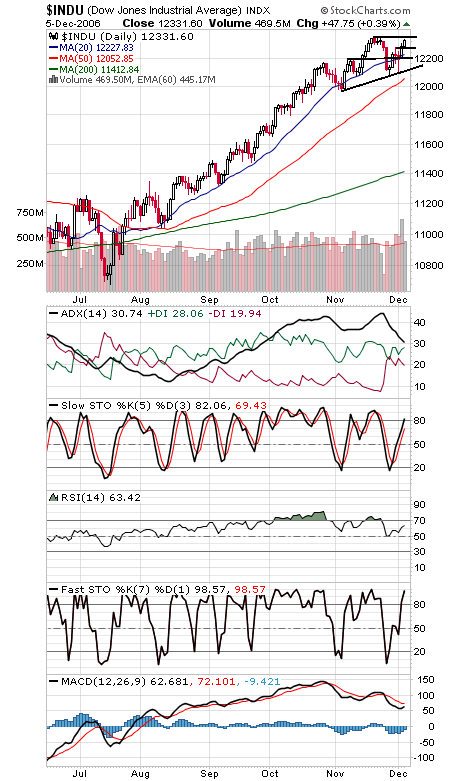
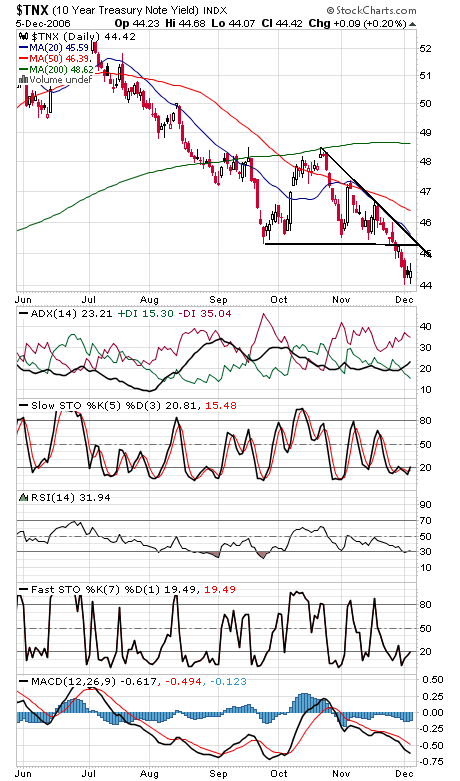
The S&P (first chart below) is at a critical juncture here, a rising resistance line that would signal a slowing rate of ascent if the big caps can’t break through. On the other hand, breaking through rising resistance would be impressive strength. Either way, 1417 is the big level for tomorrow, with 1426 next above that. Support is 1408, 1400, 1390 and 1387. The rally has certainly become choppier in the last six weeks, with the widest swings the market’s seen since August. The Nasdaq (second chart) also showed some hesitation today with a nice doji star. Resistance is 2460 and 2465-2468, and support is 2445, 2430-2434 and 2423. The Dow (third chart) is closing in on another new high at 12,355. Support is 12,275, 12,230 and 12,200. Long bond yields (fourth chart) remain stalled.


Internet News Logo

InternetNews is a source of industry news and intelligence for IT professionals from all branches of the technology world. InternetNews focuses on helping professionals grow their knowledge base and authority in their field with the top news and trends in Software, IT Management, Networking & Communications, and Small Business.

Property of TechnologyAdvice. © 2026 TechnologyAdvice. All Rights Reserved

Advertiser Disclosure: Some of the products that appear on this site are from companies from which TechnologyAdvice receives compensation. This compensation may impact how and where products appear on this site including, for example, the order in which they appear. TechnologyAdvice does not include all companies or all types of products available in the marketplace.