Technical Analysis: Rarified Air | Internet News

Technical Analysis: Rarified Air

Written By
Paul Shread
Paul Shread
Sep 14, 2006
1 minute read

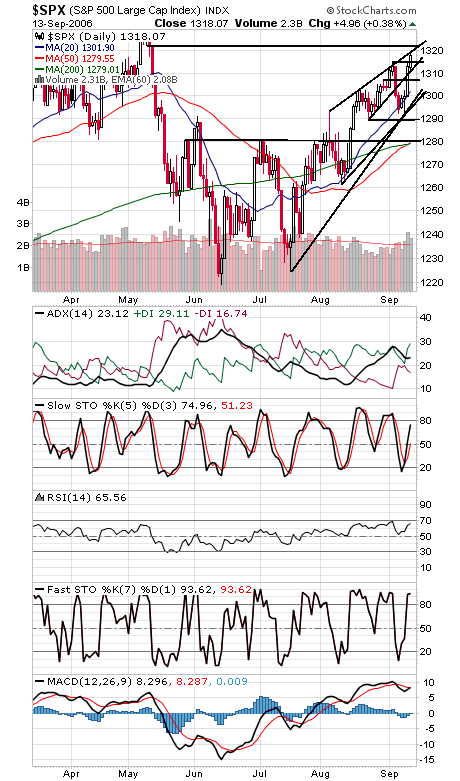
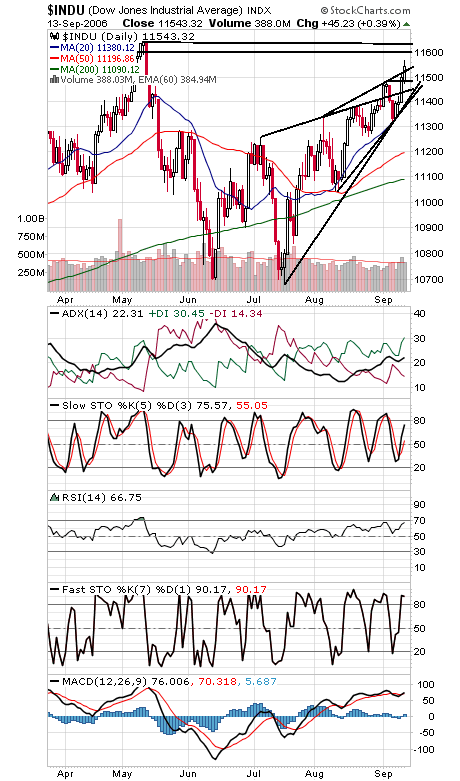
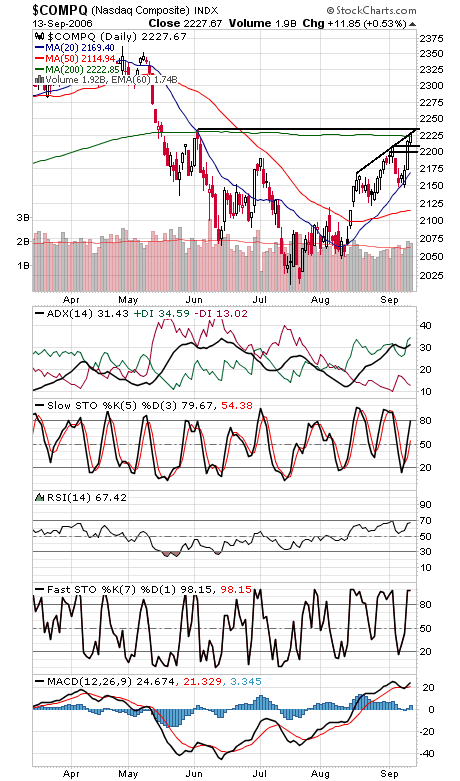
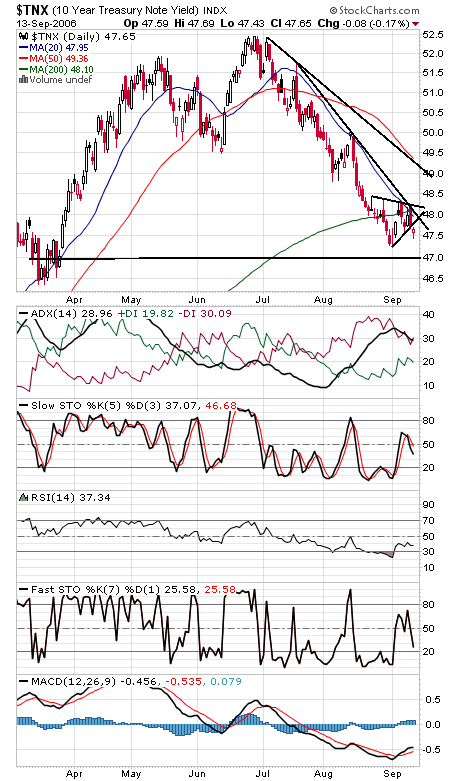
The market’s impressive strength continues, but can the indexes push to new highs in the toughest months of the year? Even 1986, the last strong mid-term year, had a tough September. The S&P (first chart below) ran into a rising resistance line that has capped rallies since early August; that makes 1320 important resistance here, with 1322 and 1327 above that. Support levels are 1315, 1312, 1310 and 1307. The Dow (second chart) also continues to push lofty levels. Resistance is 11,600 and 11,640-11,670, with the index’s all-time high of 11,722-11,750 above that. Support is 11,480-11,500, 11,450 and 11,400. The Nasdaq (third chart) is also pushing some big resistance levels here, with 2234 and 2245 the next big levels. 2223, 2207-2211 and 2200 are first support levels. Bond yields (fourth chart) remain pointed down.


Internet News Logo

InternetNews is a source of industry news and intelligence for IT professionals from all branches of the technology world. InternetNews focuses on helping professionals grow their knowledge base and authority in their field with the top news and trends in Software, IT Management, Networking & Communications, and Small Business.

Property of TechnologyAdvice. © 2026 TechnologyAdvice. All Rights Reserved

Advertiser Disclosure: Some of the products that appear on this site are from companies from which TechnologyAdvice receives compensation. This compensation may impact how and where products appear on this site including, for example, the order in which they appear. TechnologyAdvice does not include all companies or all types of products available in the marketplace.