Technical Analysis: Resistance Defined | Internet News

Technical Analysis: Resistance Defined

Written By
Paul Shread
Paul Shread
Jun 1, 2007
1 minute read

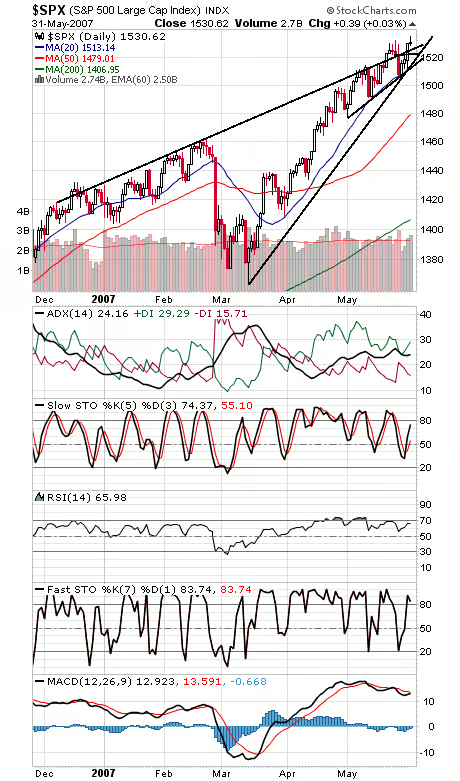
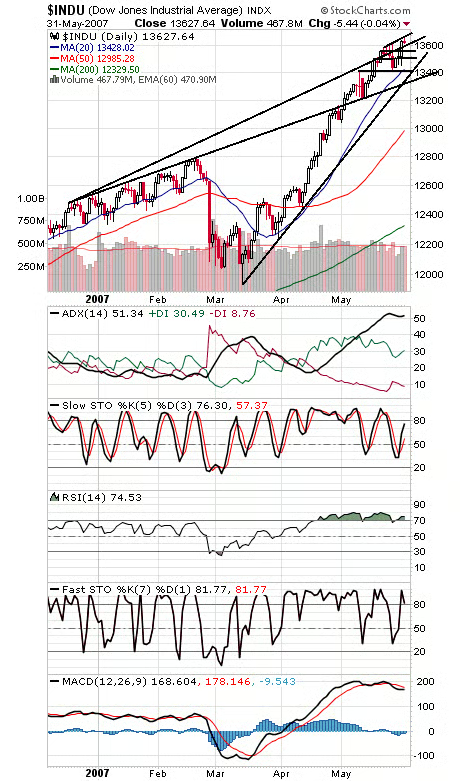
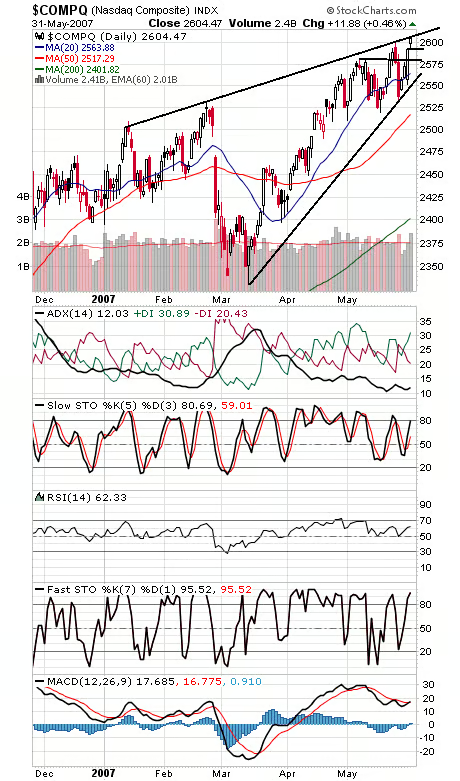
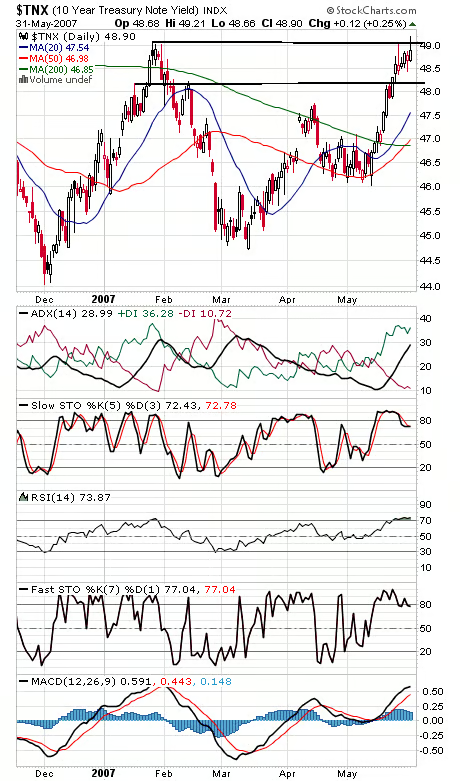
The S&P (first chart below) continues to struggle around its 2000 all-time high range of 1527.46-1552.87. This is one of the ways resistance, such as old highs or lows, works — it’s the “get me out, I’m even” impulse — everyone who held an index fund through the downturn is now tempted to cash out. Given the extent of S&P 500 index investing, the market may need to struggle a while longer in this area before it can break through. The S&P has support at 1527, 1522 and 1515-1518. The Dow (second chart) faces resistance at 13,680, and support is 13,600, 13,560 and 13,500-13,520. The Nasdaq (third chart) continues to lead here, a plus for the market. Resistance is 2609, and support is 2592-2594 and 2576-2581. Bond traders (fourth chart) continue to price in growth, not a slowdown.

Paul Shread is a Chartered Market Technician (CMT) and member of the Market Technicians Association


Internet News Logo

InternetNews is a source of industry news and intelligence for IT professionals from all branches of the technology world. InternetNews focuses on helping professionals grow their knowledge base and authority in their field with the top news and trends in Software, IT Management, Networking & Communications, and Small Business.

Property of TechnologyAdvice. © 2026 TechnologyAdvice. All Rights Reserved

Advertiser Disclosure: Some of the products that appear on this site are from companies from which TechnologyAdvice receives compensation. This compensation may impact how and where products appear on this site including, for example, the order in which they appear. TechnologyAdvice does not include all companies or all types of products available in the marketplace.