Technical Analysis: Selling Intensifies | Internet News

Technical Analysis: Selling Intensifies

Written By
Paul Shread
Paul Shread
May 18, 2006
1 minute read

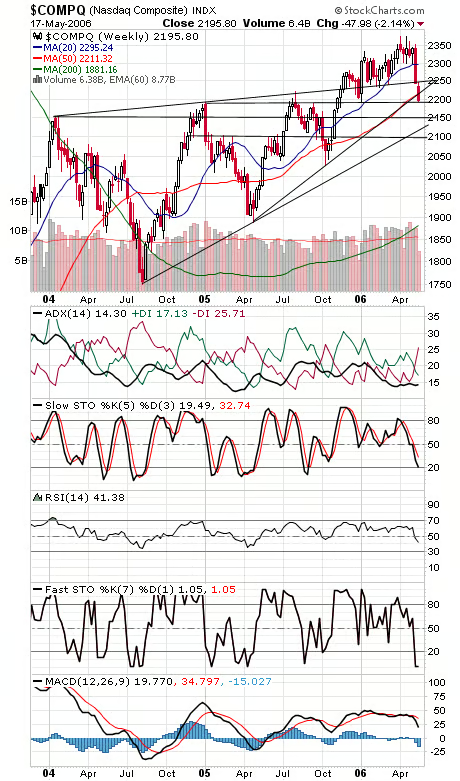
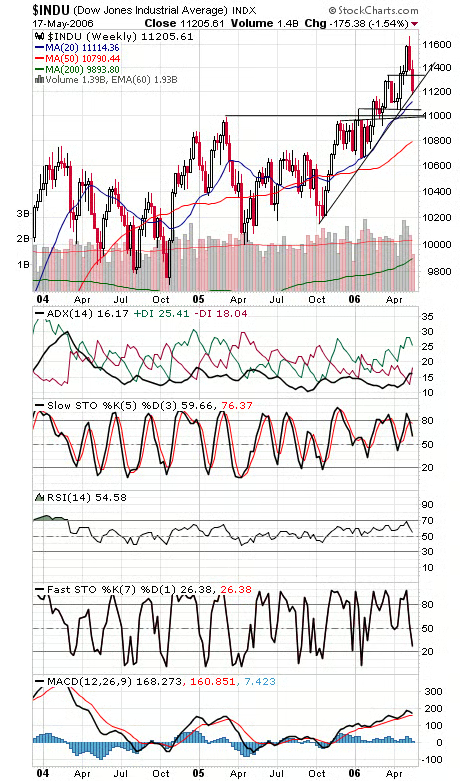
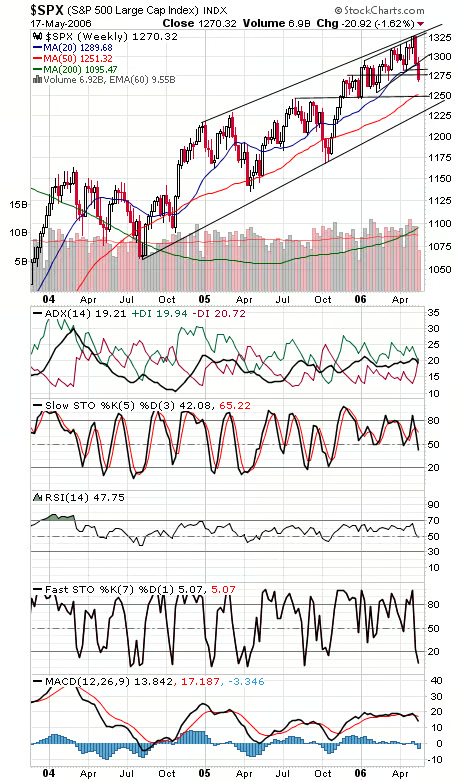
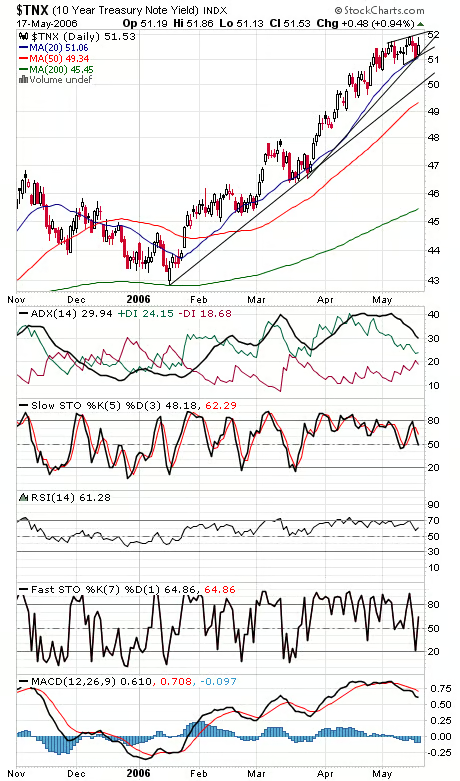
Today appears to be a 90% downside volume day on the NYSE — such intense selling could be good for a bounce, if nothing else. That said, a lot of technical damage has been done in a short amount of time. Off to the weekly charts to check. The Nasdaq (first chart below) has support at 2190, 2150, 2130 and 2100, and resistance is 2211, 2220, 2229 and 2245-2250. The Dow (second chart) held very important support at 11,175 today — a victory for the bulls there. If that goes, 11,000-11,050 might be the next target. Resistance for the blue chips is 11,275-11,280 and 11,330-11,350. The S&P (third chart) has support at 1267-1268, 1263, 1257-1258 and 1246-1251. Resistance is 1275, 1282-1284 and 1288-1290. Long bond yields (fourth chart) didn’t move to a new high despite today’s news, so we’ll call that a positive divergence for now.


Internet News Logo

InternetNews is a source of industry news and intelligence for IT professionals from all branches of the technology world. InternetNews focuses on helping professionals grow their knowledge base and authority in their field with the top news and trends in Software, IT Management, Networking & Communications, and Small Business.

Property of TechnologyAdvice. © 2026 TechnologyAdvice. All Rights Reserved

Advertiser Disclosure: Some of the products that appear on this site are from companies from which TechnologyAdvice receives compensation. This compensation may impact how and where products appear on this site including, for example, the order in which they appear. TechnologyAdvice does not include all companies or all types of products available in the marketplace.