Technical Analysis: S&P Gets Stopped | Internet News

Technical Analysis: S&P Gets Stopped

Written By
Paul Shread
Paul Shread
Aug 8, 2007
1 minute read

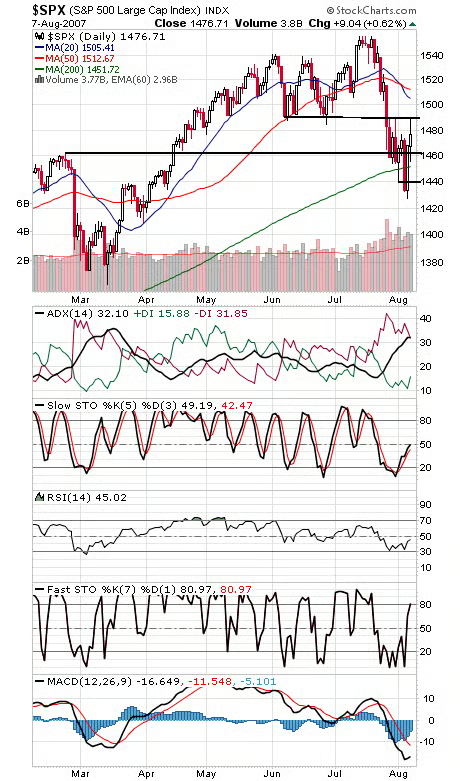
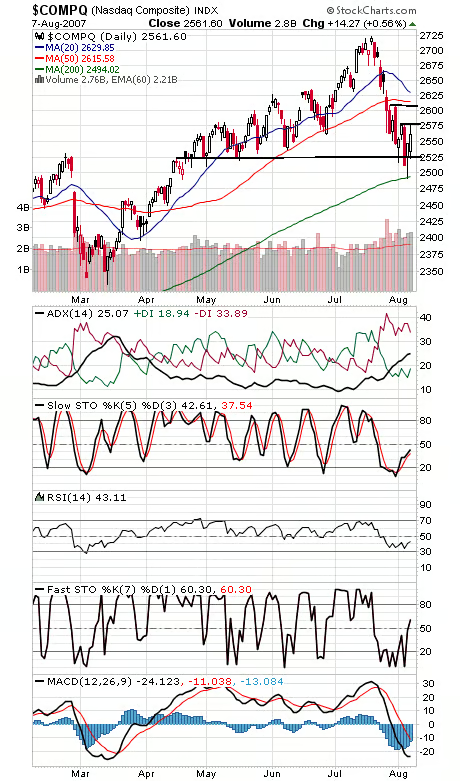
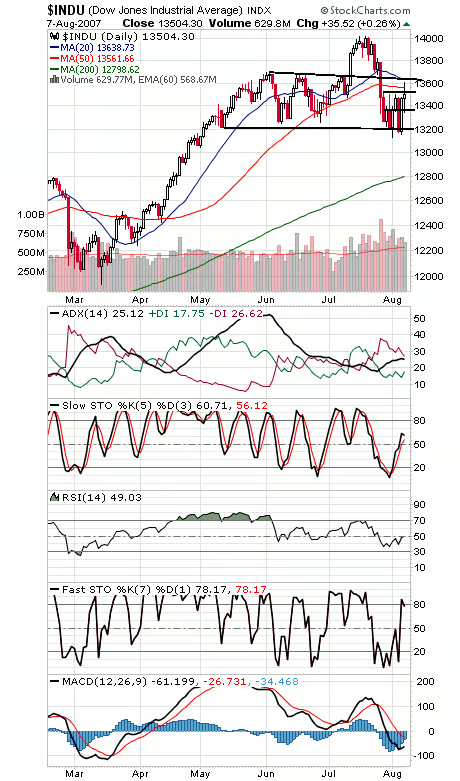
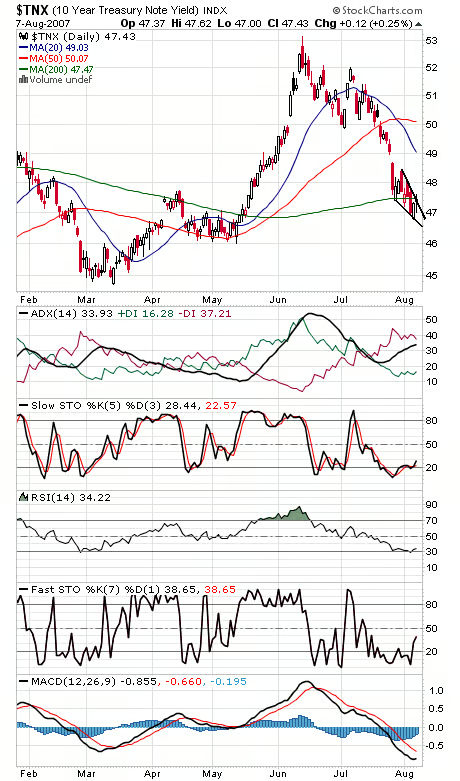
The S&P (first chart below) got stopped right at the important 1488 level today; above that and the bulls may be onto something. 1461, 1452 and 1440 are support. The Nasdaq (second chart) got stopped at 2576 resistance, with 2607-2615 looming above that, and support is 2525-2531. The Dow (third chart) broke above 13,520 resistance today but then got beaten back. 13,560 and 13,640 are waiting above that, and support is 13,350-13,400. The 10-year yield (fourth chart) is another one trying to bottom that can’t quite break out.

Paul Shread is a Chartered Market Technician (CMT) and member of the Market Technicians Association


Internet News Logo

InternetNews is a source of industry news and intelligence for IT professionals from all branches of the technology world. InternetNews focuses on helping professionals grow their knowledge base and authority in their field with the top news and trends in Software, IT Management, Networking & Communications, and Small Business.

Property of TechnologyAdvice. © 2026 TechnologyAdvice. All Rights Reserved

Advertiser Disclosure: Some of the products that appear on this site are from companies from which TechnologyAdvice receives compensation. This compensation may impact how and where products appear on this site including, for example, the order in which they appear. TechnologyAdvice does not include all companies or all types of products available in the marketplace.