Technical Analysis: S&P Hangs On | Internet News

Technical Analysis: S&P Hangs On

Written By
Paul Shread
Paul Shread
Jan 16, 2009
1 minute read

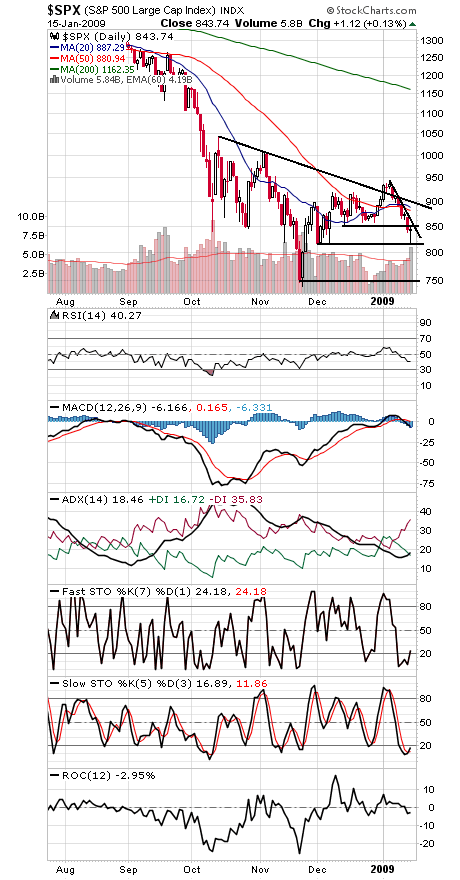
The S&P 500 (first chart below) was the only major stock index to hold support today, which makes that 815 support level doubly important now; if it goes, we could be headed back to the lows at 741.

To the upside, a move above today’s high of 851.59 could open the way to a test of the critical 880-900 resistance zone.

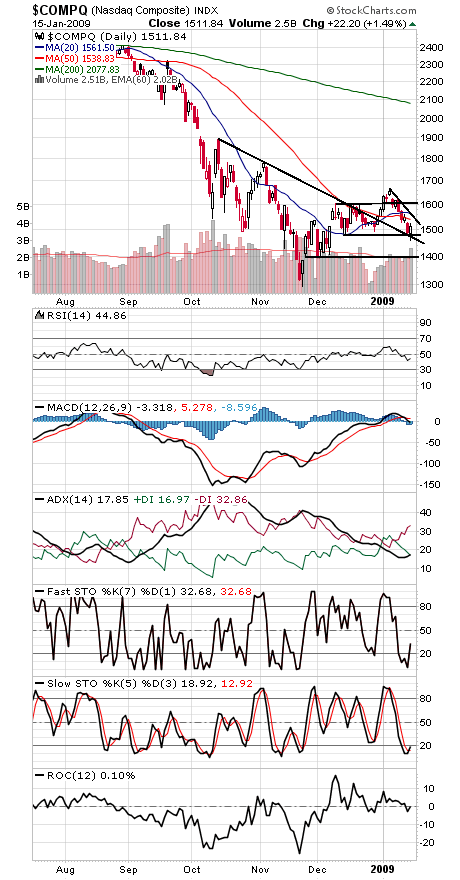
The Nasdaq (second chart) lost 1480 support before recovering today. If 1456 goes, the index could be headed to 1400. To the upside, 1540, 1560 and 1600 are resistance.

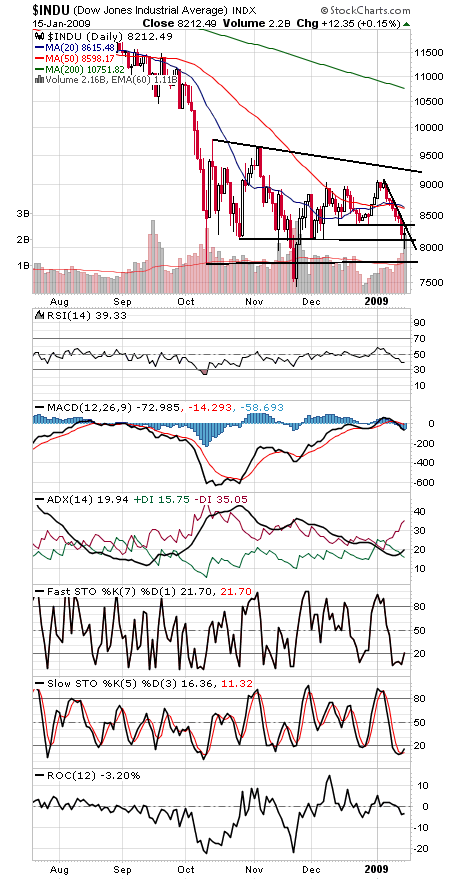
The Dow (third chart) slipped below 8000 before finding buyers. First support is 8100, with 7800 and 7500 below the 8000 level. To the upside, 8300-8350 and 8600 are resistance.

Paul Shread is a Chartered Market Technician (CMT) and member of the Market Technicians Association.

Internet News Logo

InternetNews is a source of industry news and intelligence for IT professionals from all branches of the technology world. InternetNews focuses on helping professionals grow their knowledge base and authority in their field with the top news and trends in Software, IT Management, Networking & Communications, and Small Business.

Property of TechnologyAdvice. © 2026 TechnologyAdvice. All Rights Reserved

Advertiser Disclosure: Some of the products that appear on this site are from companies from which TechnologyAdvice receives compensation. This compensation may impact how and where products appear on this site including, for example, the order in which they appear. TechnologyAdvice does not include all companies or all types of products available in the marketplace.