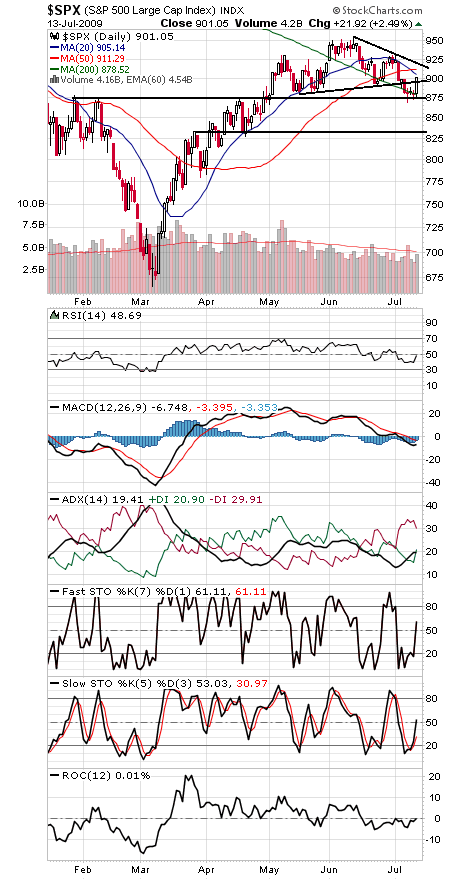
The S&P 500 (first chart below) is attempting to bottom after threatening to break down out of a two-month trading range last week.
The 910-918.67 level is solid first resistance for the index and should get tested tomorrow. If the big caps can clear that, 924-928, 932-936 and 956.23 are the next big hurdles.
First support is 892-900, and a close below 879.13 would suggest that the month-long correction isn’t over.
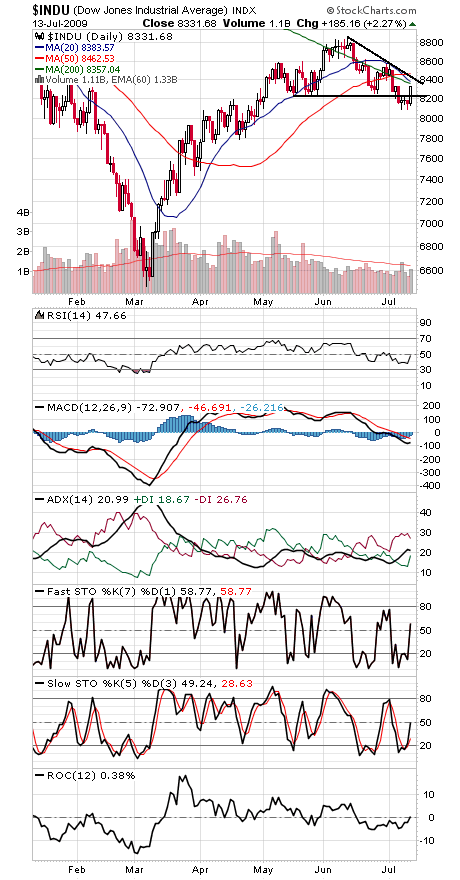
The Dow (second chart) has also reversed a breakdown here. 8259 and 8146 are support, and 8400, 8580 and 8799-8878 are resistance.
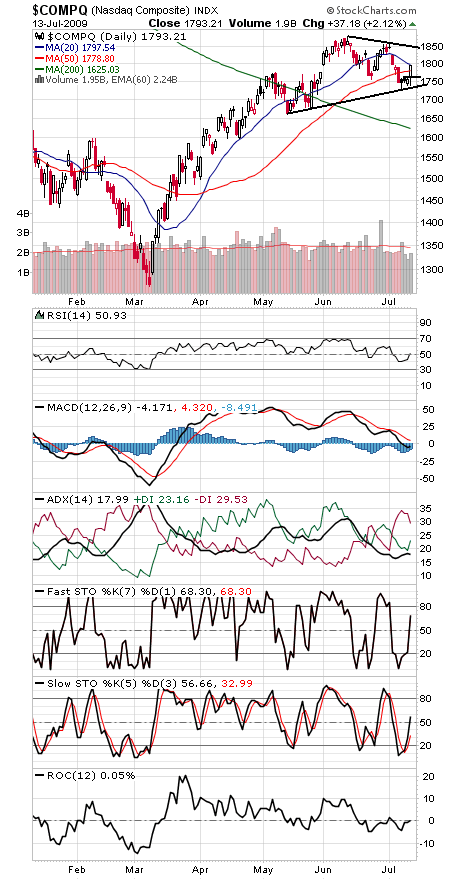
The Nasdaq (third chart) faces resistance at 1850-1880 — and an even bigger hurdle at 1905-1947. Support is 1780, 1764 and 1740.
A solid start for the bulls here, but they have a lot of work ahead of them.
Paul Shread is a Chartered Market Technician (CMT) and member of the Market Technicians Association. He is a co-author of the book “Dow Theory Unplugged” from W&A Publishing.