Technical Analysis: Stocks at Support | Internet News

Technical Analysis: Stocks at Support

Written By
Paul Shread
Paul Shread
May 10, 2008
1 minute read

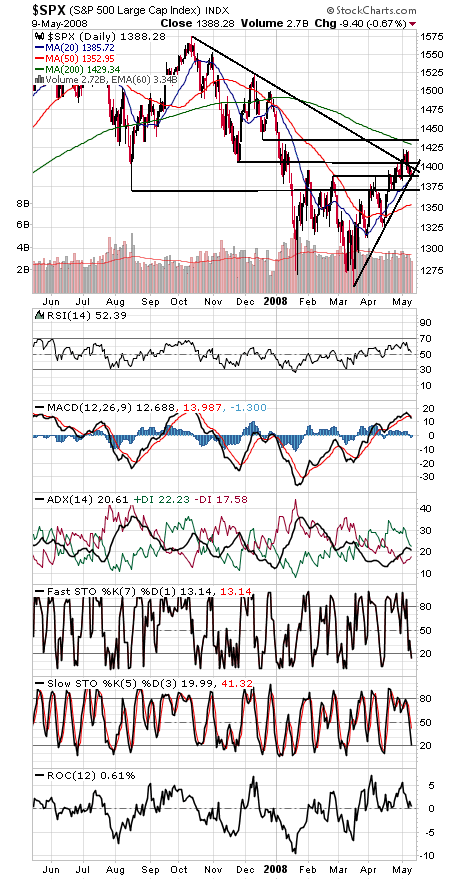
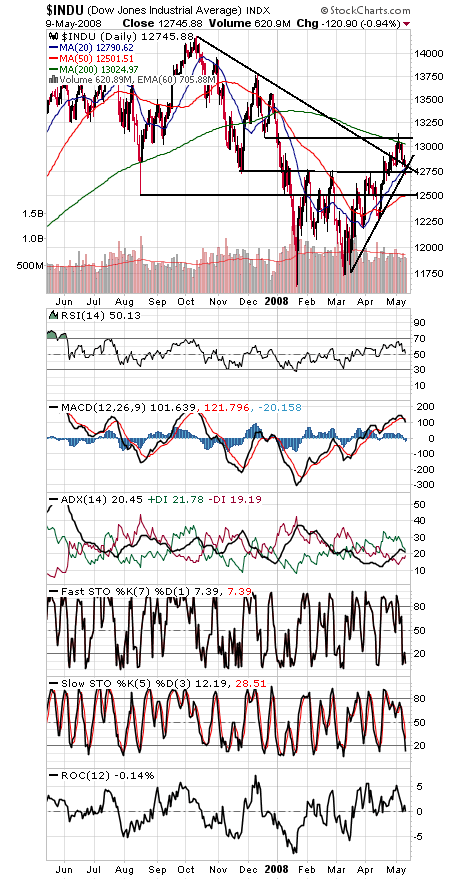
The Dow and S&P (first two charts below) are right on support here; much lower than 12,743 and 1385 and 12,500 and 1370 come into play.

To the upside, 12,800 and 13,000-13,100 and 1400-1406 and 1430-1435 are the levels the bulls have to beat.

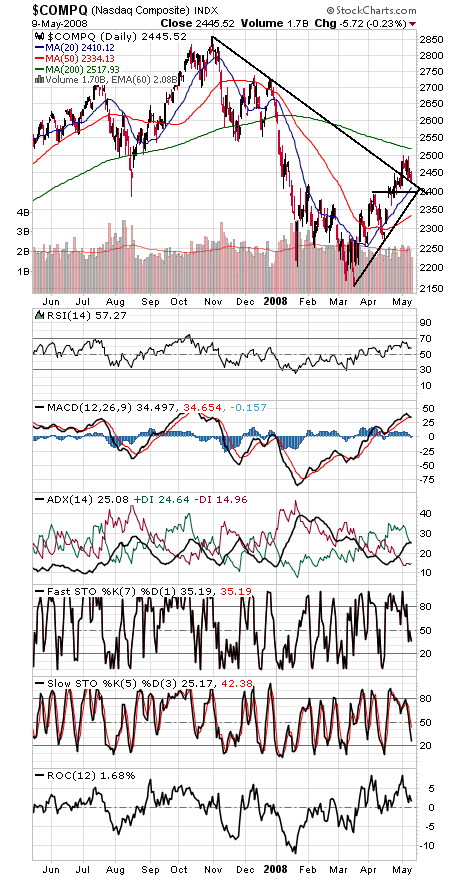
The Nasdaq (third chart) looks quite strong compared to its blue chip counterparts, holding above its late October downtrend line at about 2430, with 2390-2400 below that. To the upside, 2500-2550 is a major resistance zone.

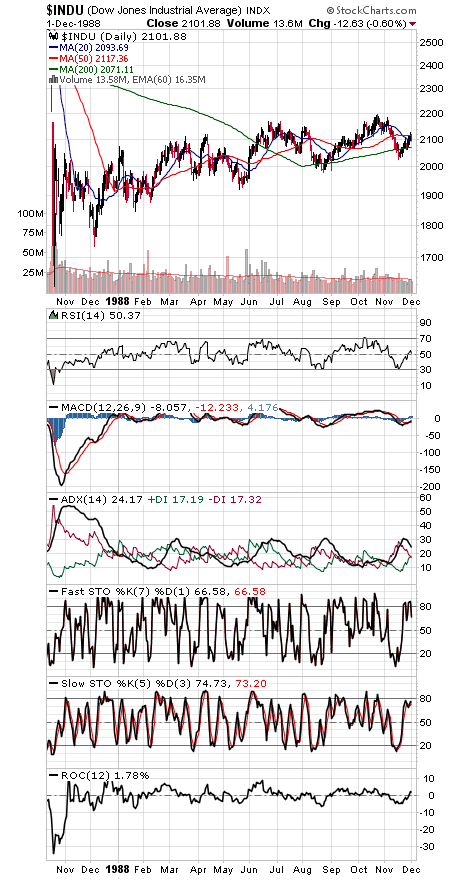
In short, a choppy market, with modest progress followed by sharp pullbacks — a trend we wouldn’t be surprised to continue until the subprime mess finally clears. For an example, see the fourth chart below for a similar trading pattern following the crash of 1987.

Paul Shread is a Chartered Market Technician (CMT) and member of the Market Technicians Association.

Internet News Logo

InternetNews is a source of industry news and intelligence for IT professionals from all branches of the technology world. InternetNews focuses on helping professionals grow their knowledge base and authority in their field with the top news and trends in Software, IT Management, Networking & Communications, and Small Business.

Property of TechnologyAdvice. © 2026 TechnologyAdvice. All Rights Reserved

Advertiser Disclosure: Some of the products that appear on this site are from companies from which TechnologyAdvice receives compensation. This compensation may impact how and where products appear on this site including, for example, the order in which they appear. TechnologyAdvice does not include all companies or all types of products available in the marketplace.