Technical Analysis: Stocks Hang On | Internet News

Technical Analysis: Stocks Hang On

Written By
Paul Shread
Paul Shread
Mar 3, 2006
1 minute read

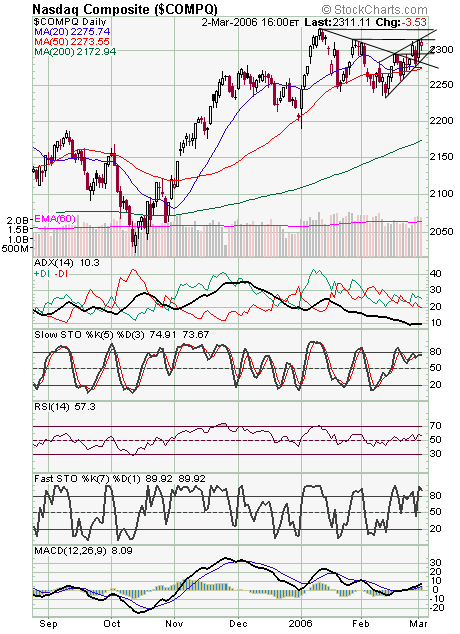
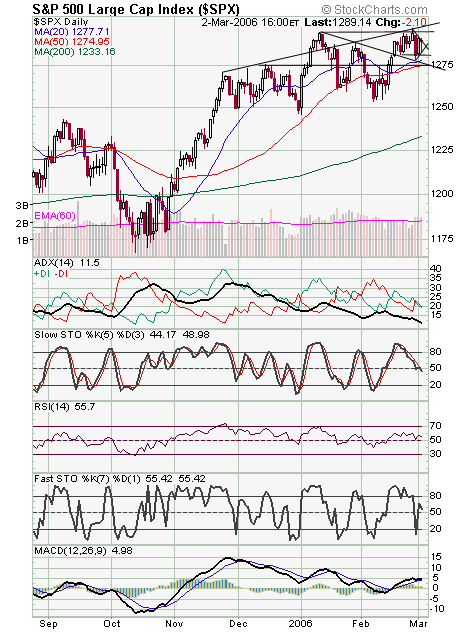
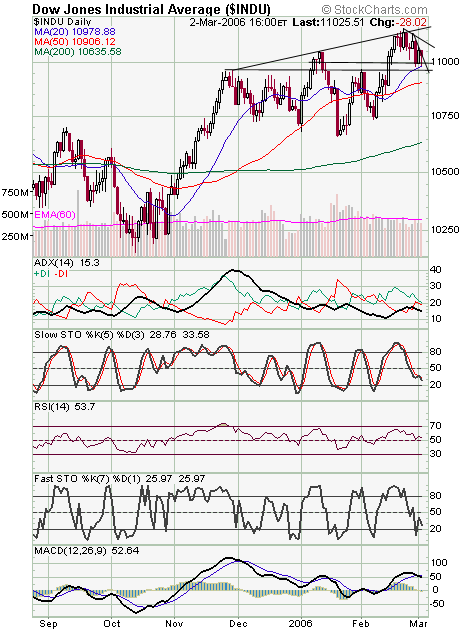
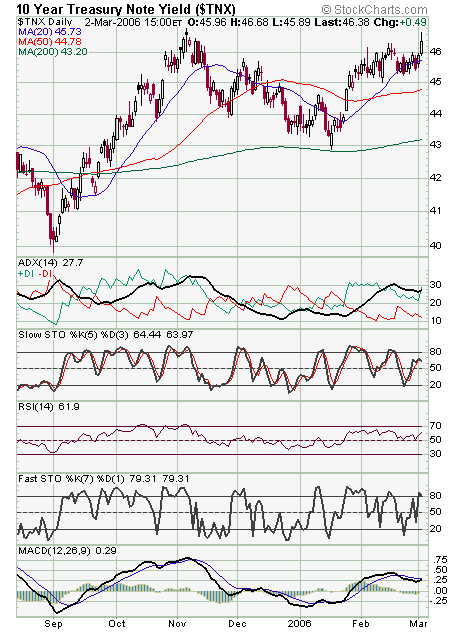
The Nasdaq (first chart below) held up well today, but it also may be losing a little momentum here, as it seems to be running into a rising resistance line. Resistance is 2320 and 2328-2333, and support is 2300, 2295, 2290, 2280 and 2274. The S&P (second chart) put in an inside day today, a sign of indecision here. Resistance is 1295-1300, and support is 1285, 1282 and 1275. The Dow (third chart) has support at 11,000, 10,960-10,980 and 10,910, and resistance is 11,100 and 11,160. Long bond yields (fourth chart) are threatening to turn up again.


Internet News Logo

InternetNews is a source of industry news and intelligence for IT professionals from all branches of the technology world. InternetNews focuses on helping professionals grow their knowledge base and authority in their field with the top news and trends in Software, IT Management, Networking & Communications, and Small Business.

Property of TechnologyAdvice. © 2026 TechnologyAdvice. All Rights Reserved

Advertiser Disclosure: Some of the products that appear on this site are from companies from which TechnologyAdvice receives compensation. This compensation may impact how and where products appear on this site including, for example, the order in which they appear. TechnologyAdvice does not include all companies or all types of products available in the marketplace.