SHARE
Facebook X Pinterest WhatsApp

Technical Analysis: Stocks Hang On

Written By
thumbnail
Paul Shread
Paul Shread
Aug 11, 2006

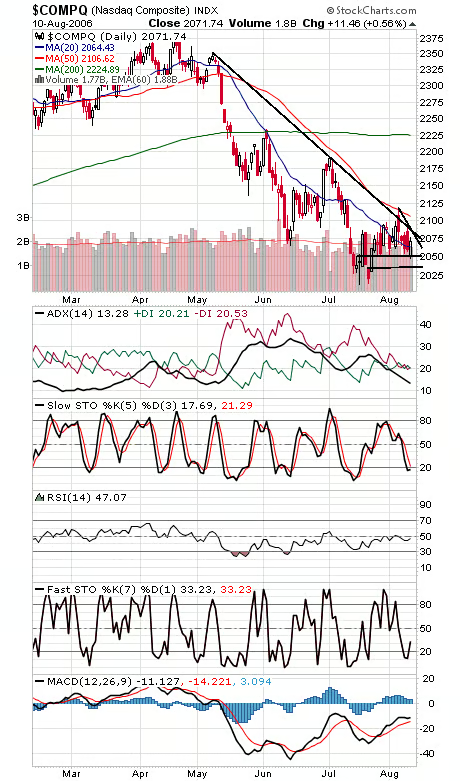
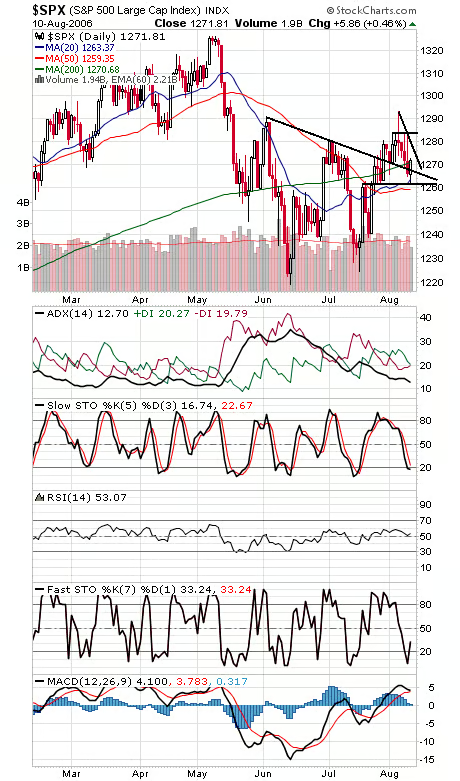
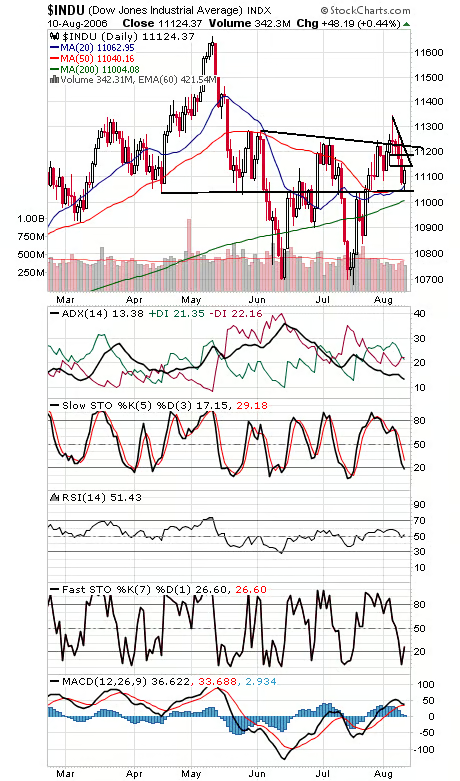
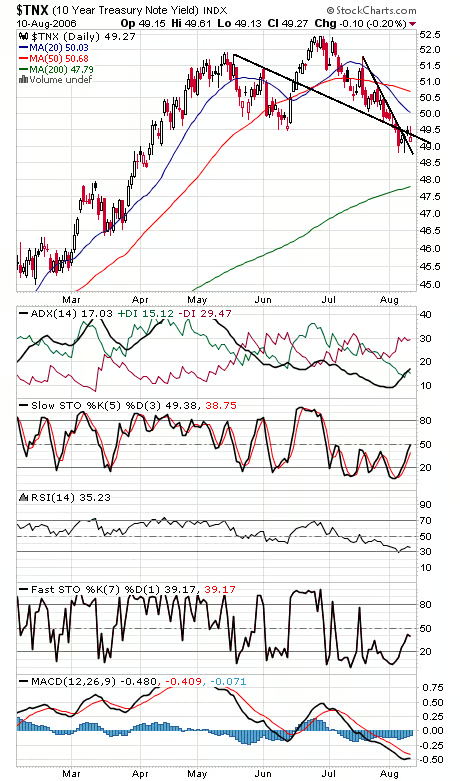
Sellers don’t quite have control of the market yet, as the indexes mounted a rebound after testing support today. The Nasdaq (first chart below) pierced 2050 support before recovering. To the upside, the techs face a tough first resistance level at 2085, the intersection of two downtrend lines. The S&P (second chart) bounced at 1261 today, just below our 1262-1263 support level. Resistance is 1275-1277, with 1284 above that, and first support levels are 1270 and 1266. The Dow (third chart) held the major support zone of 11,000-11,040. Resistance is 11,150 and 11,190-11,220. Bonds (fourth chart) benefited from a little flight to safety today.


Recommended for you...

U.S. Needs to Protect Tech Leadership: Qualcomm
Rob Enderle
Apr 8, 2022
HP’s ExtendXR Service Gets an Early Lead on a Looming Metaverse Problem
Rob Enderle
Mar 5, 2022
Cisco’s Purpose Is to Improve the World. Imagine if Others Followed.
Rob Enderle
Dec 17, 2021
HP Builds an Advanced Cloud Workstation for the Metaverse
Rob Enderle
Nov 13, 2021
Internet News Logo

InternetNews is a source of industry news and intelligence for IT professionals from all branches of the technology world. InternetNews focuses on helping professionals grow their knowledge base and authority in their field with the top news and trends in Software, IT Management, Networking & Communications, and Small Business.

Property of TechnologyAdvice. © 2025 TechnologyAdvice. All Rights Reserved

Advertiser Disclosure: Some of the products that appear on this site are from companies from which TechnologyAdvice receives compensation. This compensation may impact how and where products appear on this site including, for example, the order in which they appear. TechnologyAdvice does not include all companies or all types of products available in the marketplace.