The major stock indexes are trying to form modest uptrends over the last three weeks, but they need to turn up soon or the next move could be down.
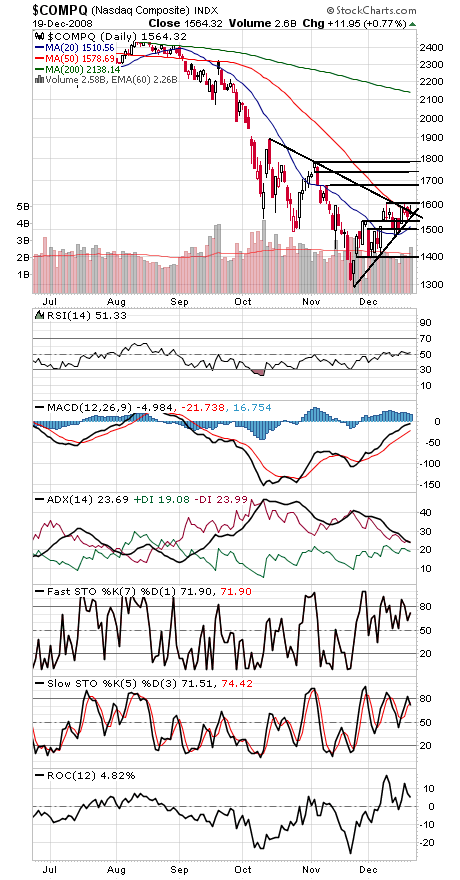
The Nasdaq (first chart below) has the strongest uptrend of the major indexes, but it wouldn’t take much of a move lower to break it, just five points or so. If that happens, 1535-1540 and 1500 could come into play to the downside. To the upside, the index needs to clear 1603 with conviction to open the way for a move to 1680.
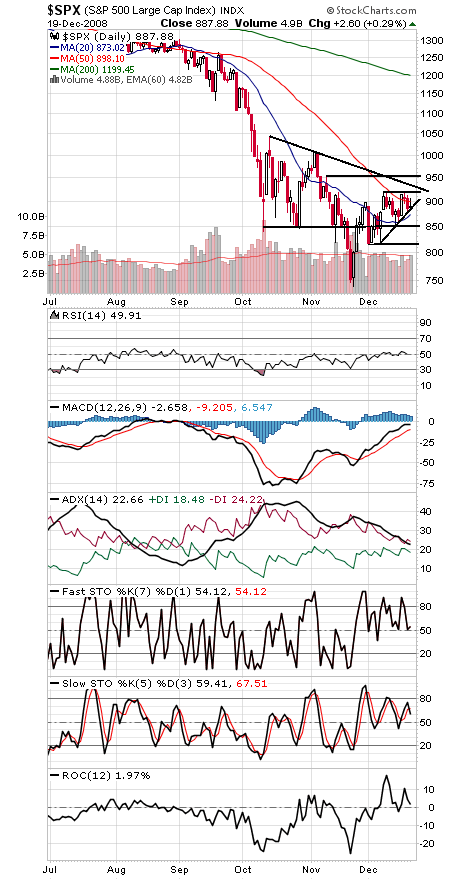
The S&P (second chart) is also just barely hanging on here. Any move lower would break the uptrend and set up a possible test of 840-850 and 815-818. To the upside, 918 is proving a tough hurdle, with 930 and 950 above that.
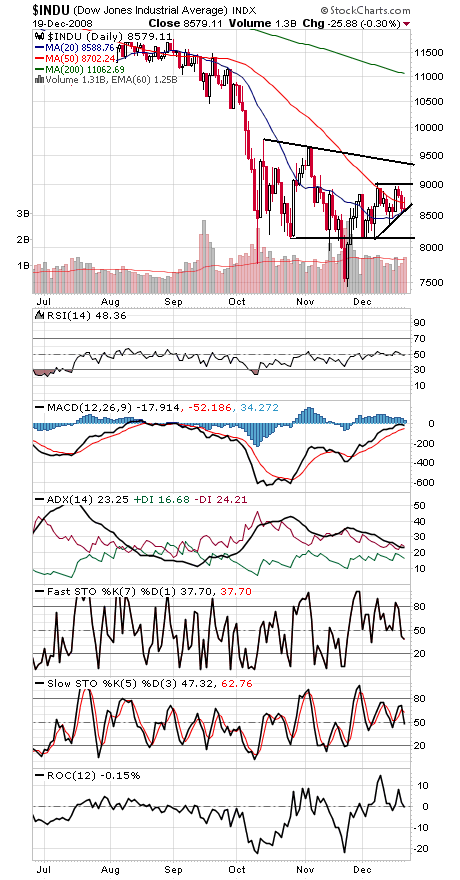
Any move lower in the Dow (third chart) could set up a potential decline to 8150. To the upside, 8700 and 9000 are just the start of resistance.
Paul Shread is a Chartered Market Technician (CMT) and member of the Market Technicians Association.