Technical Analysis: Stocks Hang On | Internet News

Technical Analysis: Stocks Hang On

Written By
Paul Shread
Paul Shread
Oct 18, 2006
1 minute read

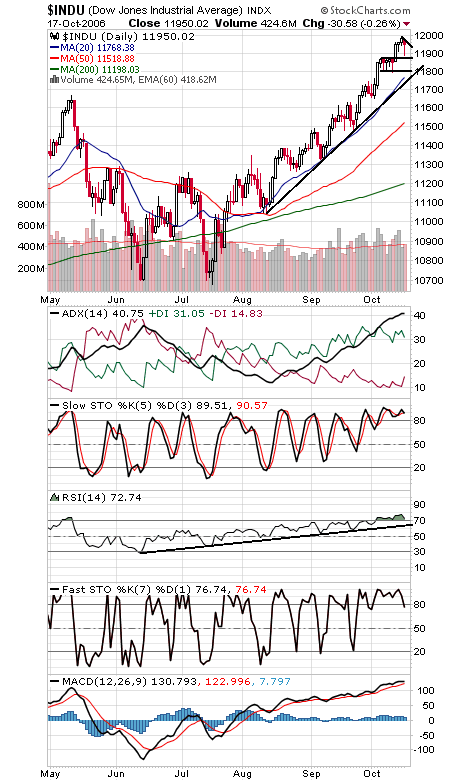
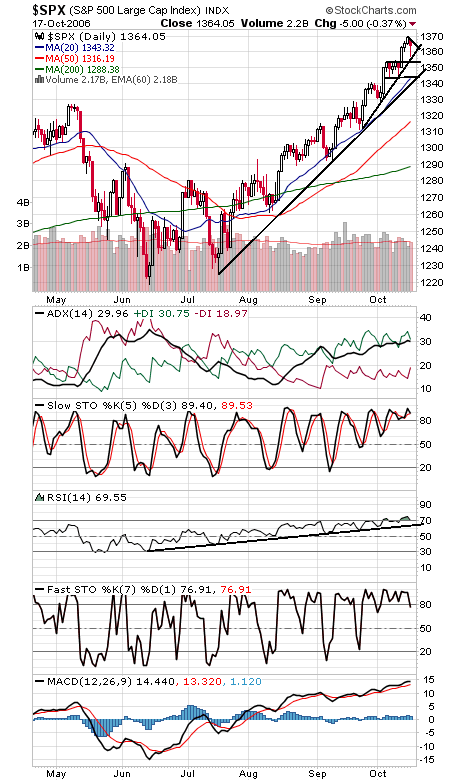
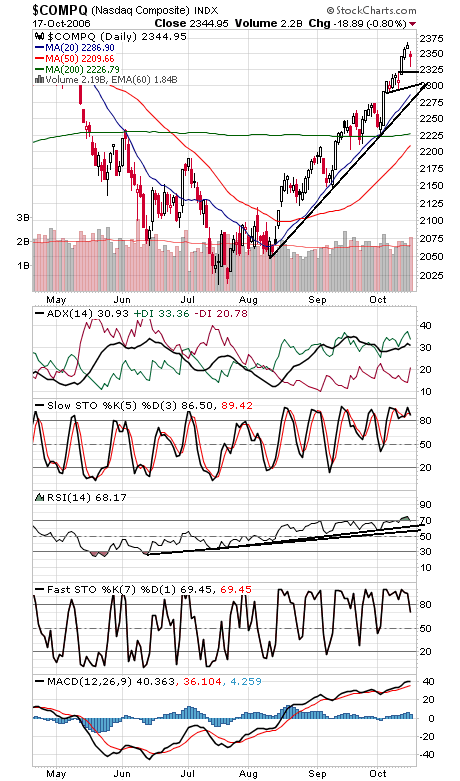
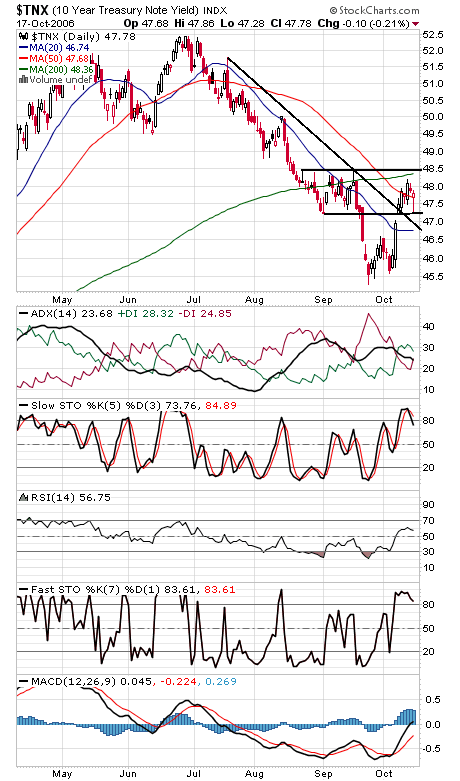
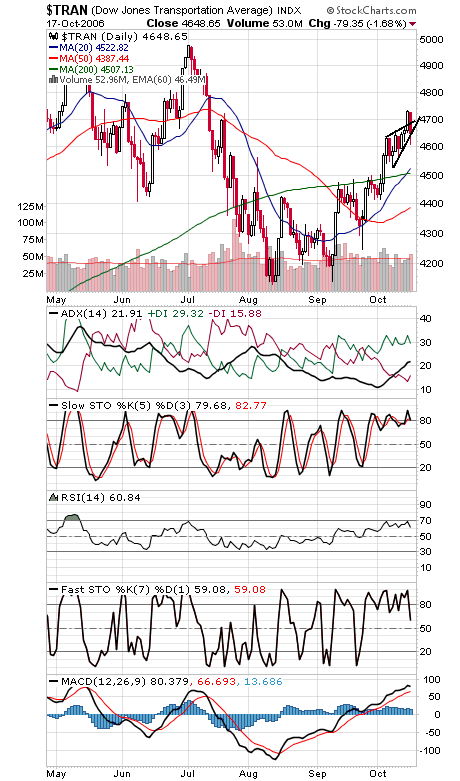
The market’s ability to fend off sellers remains impressive, but with an extremely overbought market, we suspect that significant upside will be tough to come by until some of that overbought condition is relieved. 12,000 remains the big lure for the Dow (first chart below), while support is 11,880, 11,800 and 11,750. The S&P (second chart) has support at 1358, 1354 and 1342-1344, and resistance is 1370 and 1376-1389. The Nasdaq (third chart) has resistance at 2354, 2364 and 2375, and support is 2330, 2323-2325 and 2290-2300. Bond traders (fourth chart) didn’t know what to make of today’s mixed inflation data either. Finally, Transports (fifth chart) reversed yesterday’s breakout and almost broke down in the process; one to watch here.


Internet News Logo

InternetNews is a source of industry news and intelligence for IT professionals from all branches of the technology world. InternetNews focuses on helping professionals grow their knowledge base and authority in their field with the top news and trends in Software, IT Management, Networking & Communications, and Small Business.

Property of TechnologyAdvice. © 2026 TechnologyAdvice. All Rights Reserved

Advertiser Disclosure: Some of the products that appear on this site are from companies from which TechnologyAdvice receives compensation. This compensation may impact how and where products appear on this site including, for example, the order in which they appear. TechnologyAdvice does not include all companies or all types of products available in the marketplace.