Technical Analysis: Stocks Hold Up | Internet News

Technical Analysis: Stocks Hold Up

Written By
Paul Shread
Paul Shread
Jun 17, 2006
1 minute read

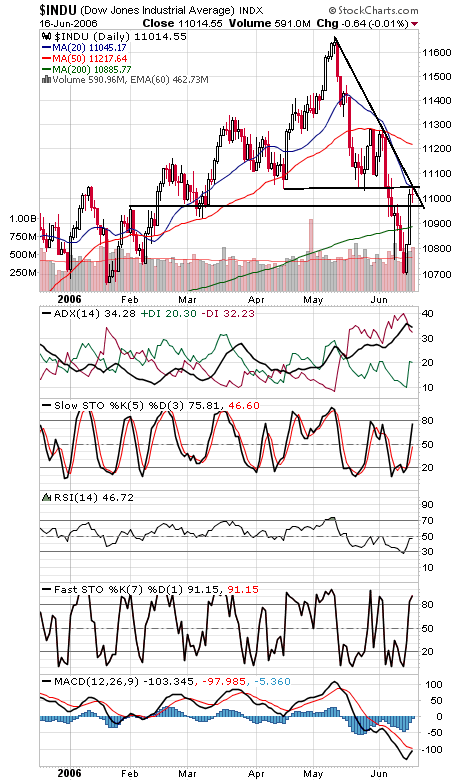
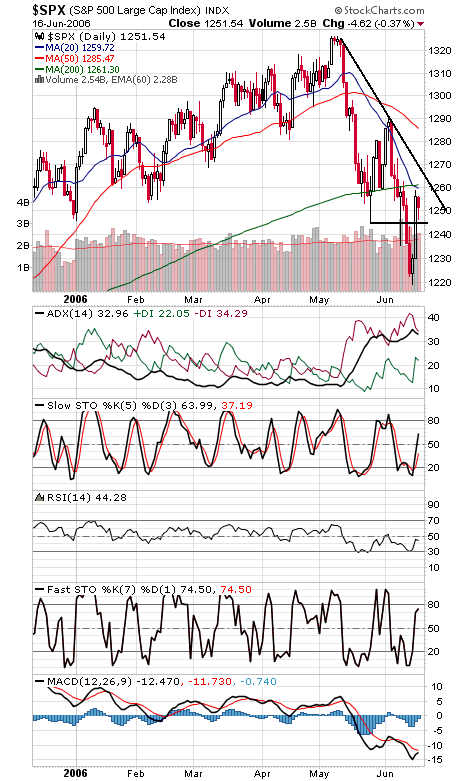
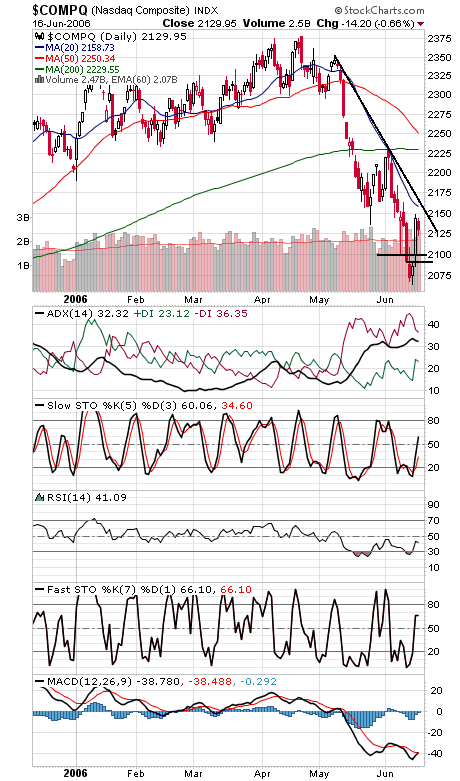
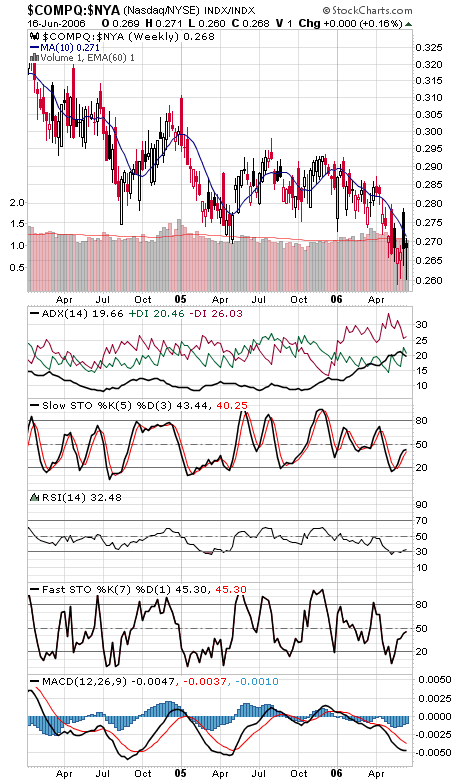
A victory of sorts for the bulls today, with little profit-taking after two days of very big gains. The one negative is they couldn’t put much of a dent in the major resistance level of 11,040-11,050 on the Dow (first chart below). Support is 10,950 and 10,888. The S&P (second chart) faces resistance at 1262 and 1267, and support is 1245 and 1230-1235. The Nasdaq (third chart) faces tough resistance at 2160, and support is 2120 and 2090-2100. In the fourth chart, a look at the 10-week average of Nasdaq/NYSE relative strength (an indicator of Gerald Appel) shows tech stocks underperforming for all but three weeks since December. It’s hard for the market to go very far without tech leadership. Long bond yields (fifth chart) continue to creep higher.


Internet News Logo

InternetNews is a source of industry news and intelligence for IT professionals from all branches of the technology world. InternetNews focuses on helping professionals grow their knowledge base and authority in their field with the top news and trends in Software, IT Management, Networking & Communications, and Small Business.

Property of TechnologyAdvice. © 2026 TechnologyAdvice. All Rights Reserved

Advertiser Disclosure: Some of the products that appear on this site are from companies from which TechnologyAdvice receives compensation. This compensation may impact how and where products appear on this site including, for example, the order in which they appear. TechnologyAdvice does not include all companies or all types of products available in the marketplace.