Technical Analysis: Stocks Stabilize | Internet News

Technical Analysis: Stocks Stabilize

Written By
Paul Shread
Paul Shread
Jan 27, 2007
1 minute read

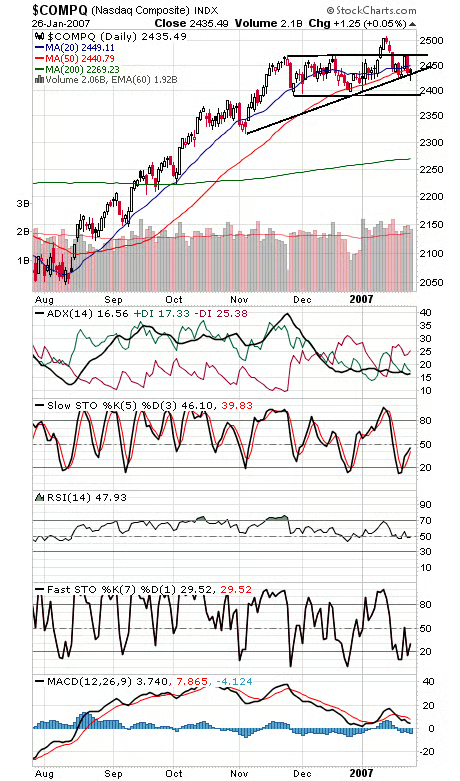
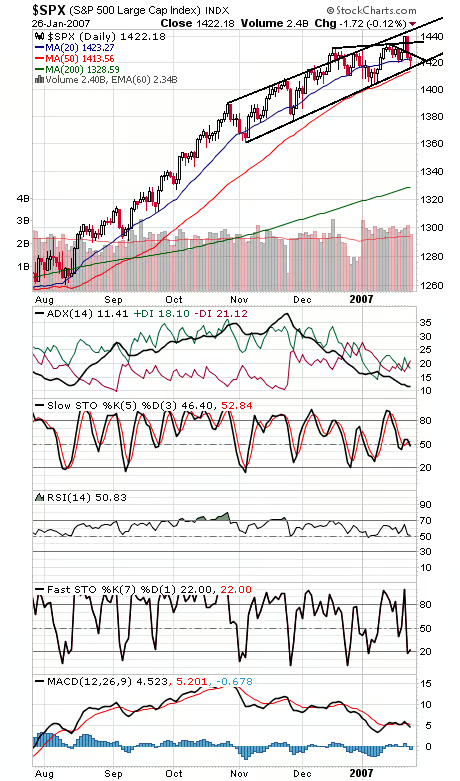
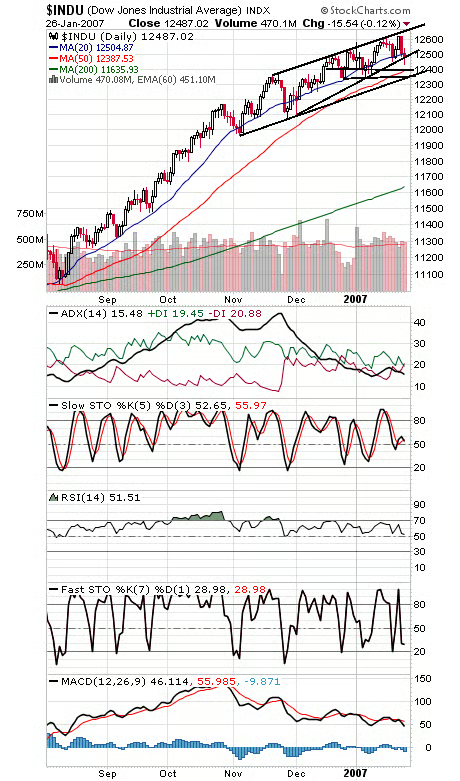
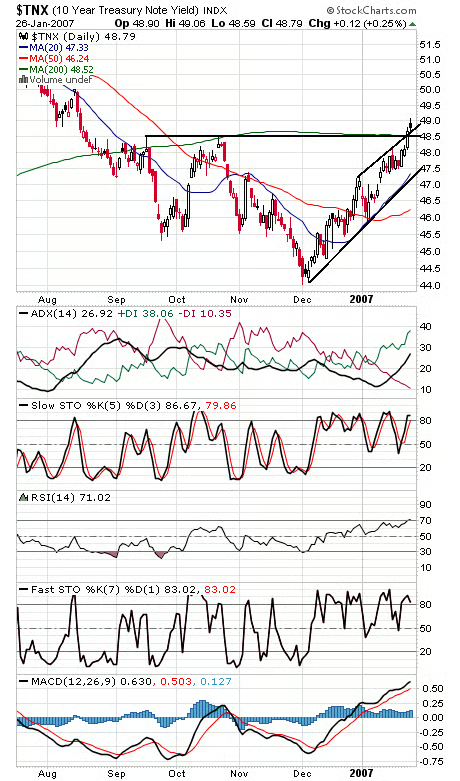
Stocks seem to have found some support here, and just in time for end-of-the-month inflows. Still, the rockiness could continue ahead of Wednesday’s GDP report (and Google’s earnings). The Nasdaq (first chart below) is threatening to lose its November uptrend here. Support is 2418 and 2390-2400, and resistance is 2441-2443, 2450-2455 and 2471. The S&P (second chart) held its November uptrend line today; call it 1417-1418 for Monday, with the 50-day average at 1414. Resistance is 1427, 1435 and 1441. The Dow (third chart) has its November trendline back at 12,350. 12,431 and 12,400 are first supports, and first resistance is 12,539-12,550. The 10-year yield (fourth chart) put in a doji star today and is looking pretty extended. Time for a pullback?


Internet News Logo

InternetNews is a source of industry news and intelligence for IT professionals from all branches of the technology world. InternetNews focuses on helping professionals grow their knowledge base and authority in their field with the top news and trends in Software, IT Management, Networking & Communications, and Small Business.

Property of TechnologyAdvice. © 2026 TechnologyAdvice. All Rights Reserved

Advertiser Disclosure: Some of the products that appear on this site are from companies from which TechnologyAdvice receives compensation. This compensation may impact how and where products appear on this site including, for example, the order in which they appear. TechnologyAdvice does not include all companies or all types of products available in the marketplace.