Technical Analysis: Stocks Trend Lower | Internet News

Technical Analysis: Stocks Trend Lower

Written By
Paul Shread
Paul Shread
Apr 18, 2006
1 minute read

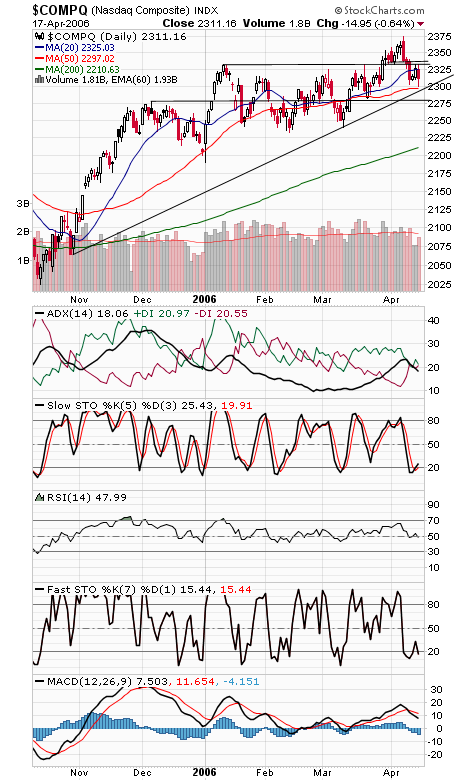
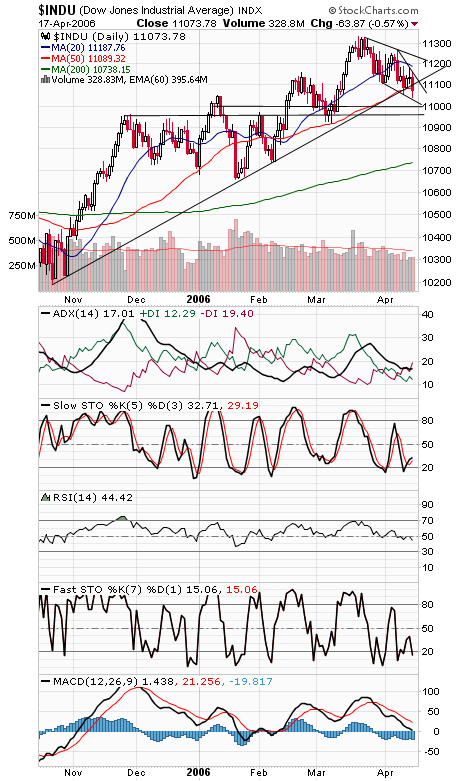
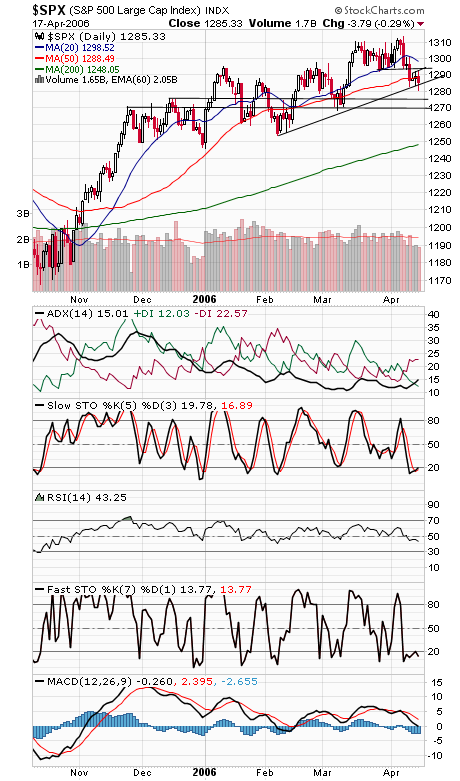
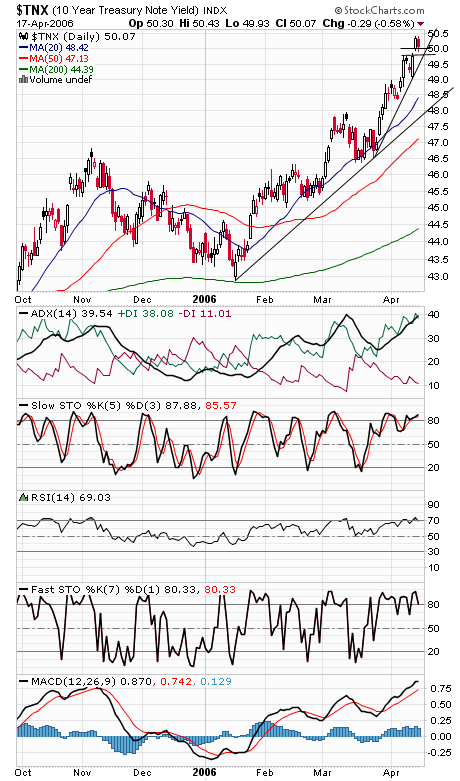
The Nasdaq (first chart below) should have solid support at 2295-2300. If that fails to hold, 2280 is the next strong support level. To the upside, 2333 is turning out to be tough resistance once again. The Dow (second chart) has broken quite a bit of support, but it doesn’t seem to be going down in a big hurry and also could be forming a bullish falling wedge here. 11,030, 11,000 and 10,950 are support, and resistance is 11,089, 11,105 and 11,130. The S&P (third chart) faces resistance at 1293-1295 and 1300, with 1310-1316 above that, and support is 1280, 1275 and 1270. Clearly, 5% is an important psychological level on long bond yields (fourth chart).


Internet News Logo

InternetNews is a source of industry news and intelligence for IT professionals from all branches of the technology world. InternetNews focuses on helping professionals grow their knowledge base and authority in their field with the top news and trends in Software, IT Management, Networking & Communications, and Small Business.

Property of TechnologyAdvice. © 2026 TechnologyAdvice. All Rights Reserved

Advertiser Disclosure: Some of the products that appear on this site are from companies from which TechnologyAdvice receives compensation. This compensation may impact how and where products appear on this site including, for example, the order in which they appear. TechnologyAdvice does not include all companies or all types of products available in the marketplace.