Technical Analysis: Stocks Turn Lower | Internet News

Technical Analysis: Stocks Turn Lower

Written By
Paul Shread
Paul Shread
Jun 28, 2006
1 minute read

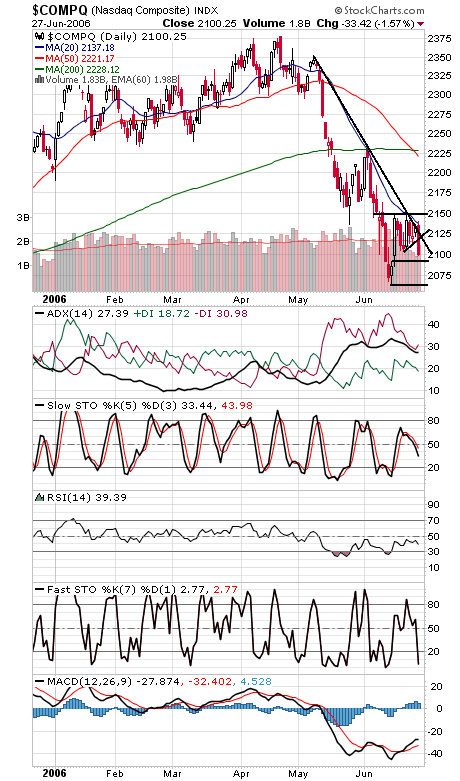
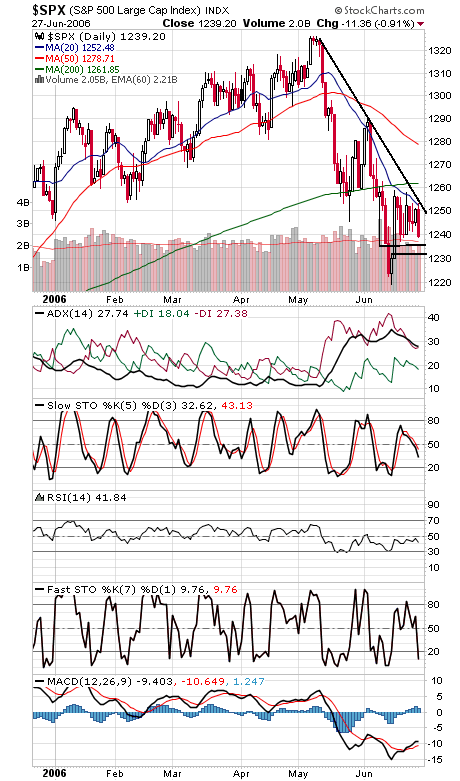
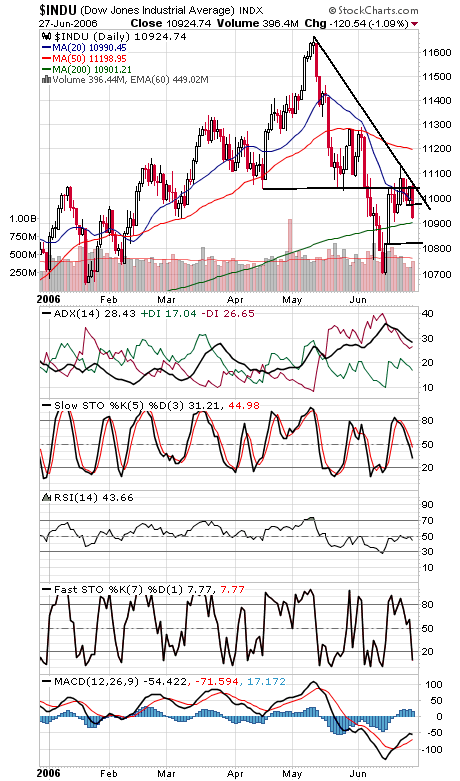
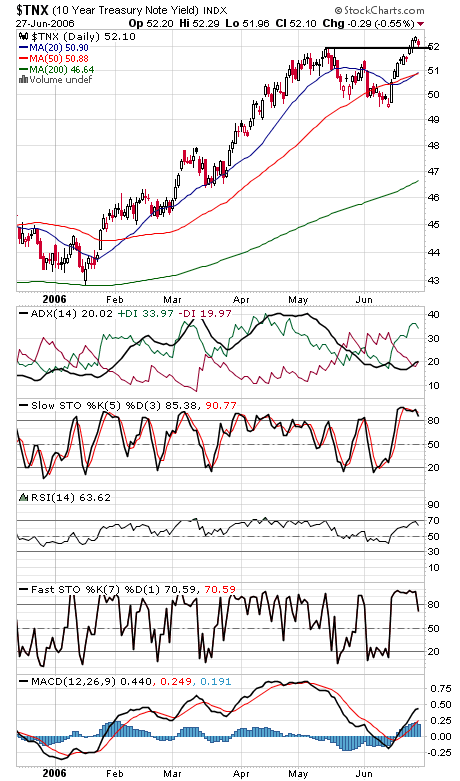
A brief breakout by the Nasdaq (first chart below) turned out to be an opportunity for sellers, who sent the index back below a couple of support levels. Support is now 2090 and 2065, and resistance is 2120-2125 and 2150. The S&P (second chart) stopped right at its downtrend line today. Next support levels are 1235-1237 and 1232, and resistance is 1252 and 1262. The Dow (third chart) has support at 10,900-10,903 and 10,820, and resistance is 10,975, 11,000 and 11,040. Long bond yields (fourth chart) saw a little flight to quality today.


Internet News Logo

InternetNews is a source of industry news and intelligence for IT professionals from all branches of the technology world. InternetNews focuses on helping professionals grow their knowledge base and authority in their field with the top news and trends in Software, IT Management, Networking & Communications, and Small Business.

Property of TechnologyAdvice. © 2026 TechnologyAdvice. All Rights Reserved

Advertiser Disclosure: Some of the products that appear on this site are from companies from which TechnologyAdvice receives compensation. This compensation may impact how and where products appear on this site including, for example, the order in which they appear. TechnologyAdvice does not include all companies or all types of products available in the marketplace.