Technical Analysis: Strong Rally | Internet News

Technical Analysis: Strong Rally

Written By
Paul Shread
Paul Shread
Jun 2, 2006
1 minute read

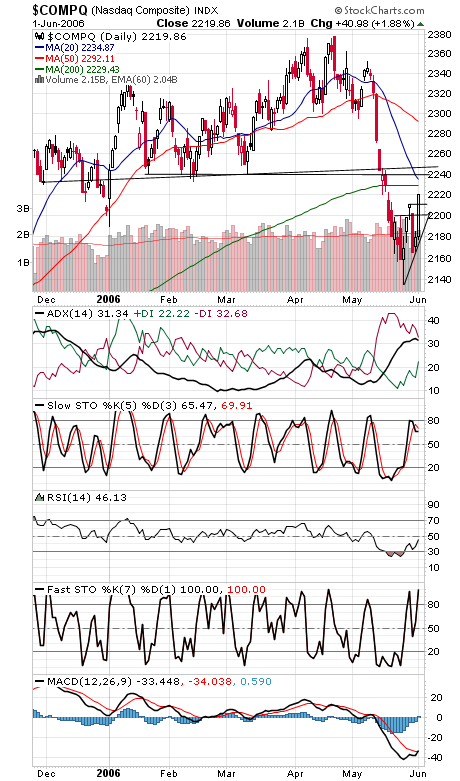
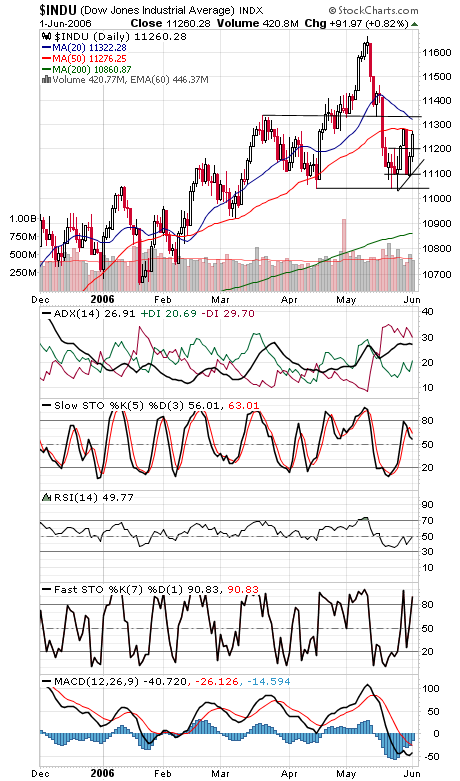
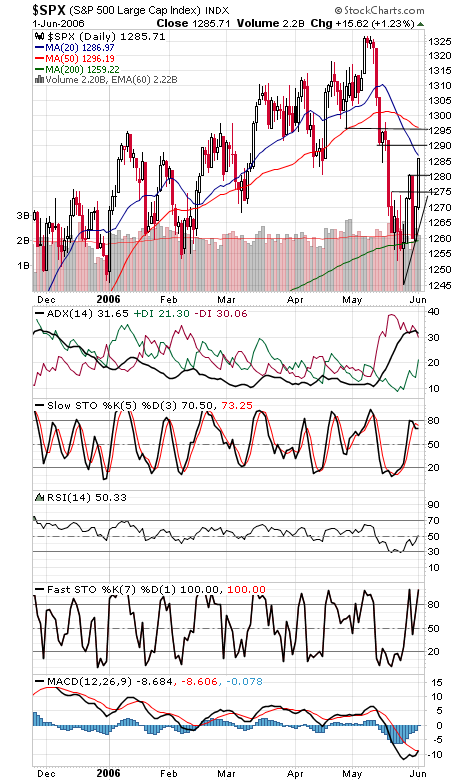
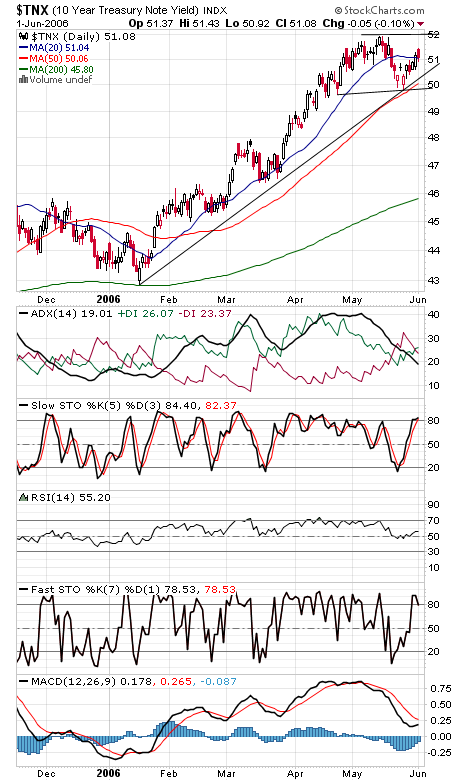
The back-to-back 80% upside volume days on the NYSE the last two days are a potentially bullish development, coming two weeks after a 90% downside day. The big question is whether sellers have been exhausted enough for sustained buying to kick in, and only time will tell. The big test will be how the Nasdaq (first chart below) handles the major resistance level of 2240-2245, with 2229 the first test for the index. Support is now 2215, 2200 and 2185. The Dow (second chart) faces tough resistance at 11,276 and 11,330, and support is 11,200 and 11,100-11,120. The S&P (third chart) faces resistance at 1290, 1296 and 1300, and support is 1281, 1275 and 1267. Long bond yields (fourth chart) remain stuck in neutral here.


Internet News Logo

InternetNews is a source of industry news and intelligence for IT professionals from all branches of the technology world. InternetNews focuses on helping professionals grow their knowledge base and authority in their field with the top news and trends in Software, IT Management, Networking & Communications, and Small Business.

Property of TechnologyAdvice. © 2026 TechnologyAdvice. All Rights Reserved

Advertiser Disclosure: Some of the products that appear on this site are from companies from which TechnologyAdvice receives compensation. This compensation may impact how and where products appear on this site including, for example, the order in which they appear. TechnologyAdvice does not include all companies or all types of products available in the marketplace.