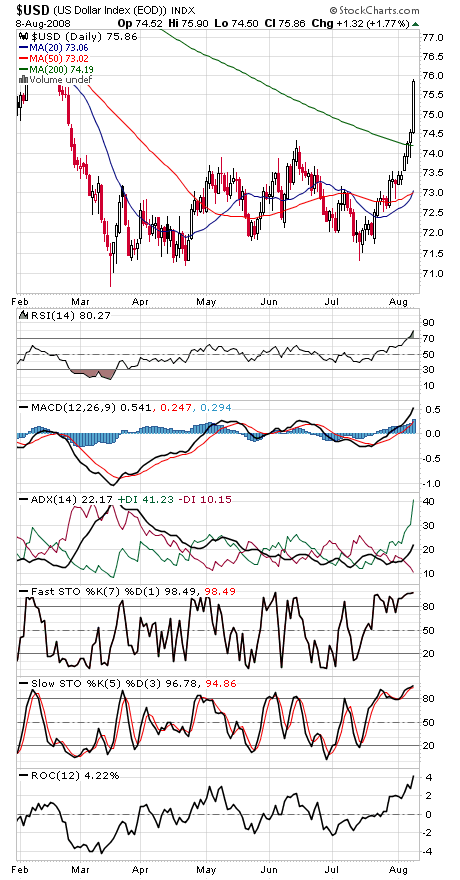
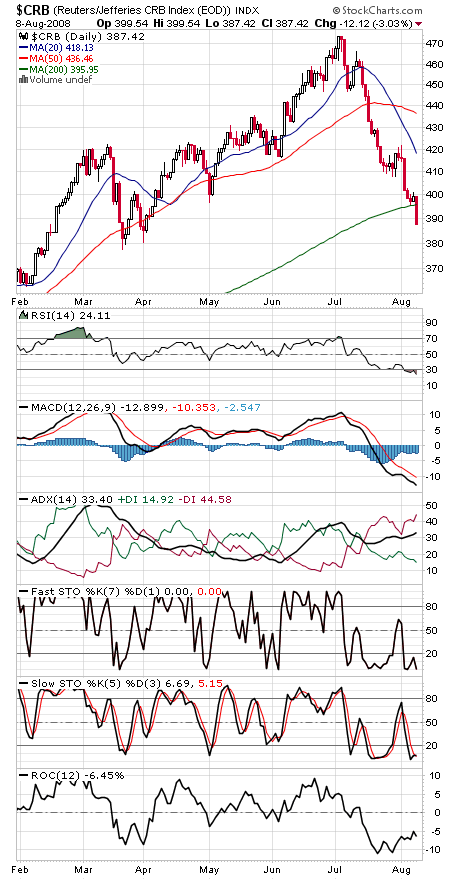
Some very positive developments on the inflation front — just look at the dollar and commodity charts (first two charts below).
Now all we need are some signs that the credit market troubles are easing — and some forceful upside buying that appears to be more than just sector rotation.
Still, for now at least, the charts are pointed up and making steady progress.
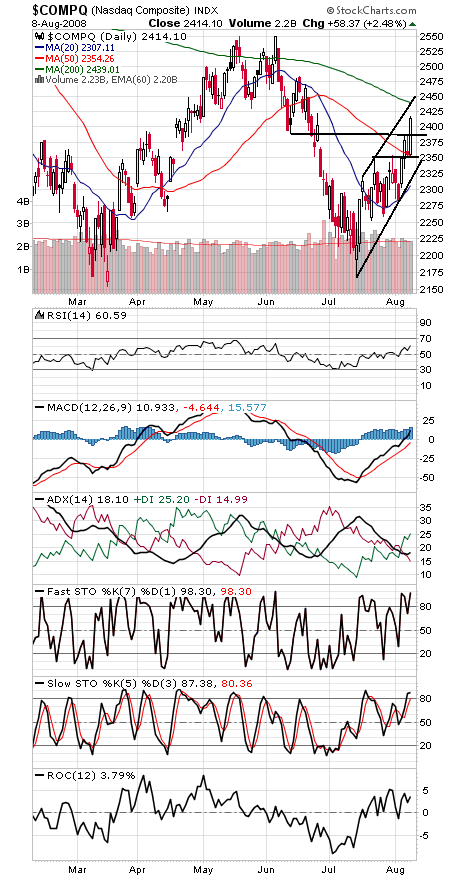
The Nasdaq (third chart) remains the strongest sector and appears headed for a test of its 200-day average and an upper channel line, between 2439 and 2450. Support is 2386, 2350 and 2330.
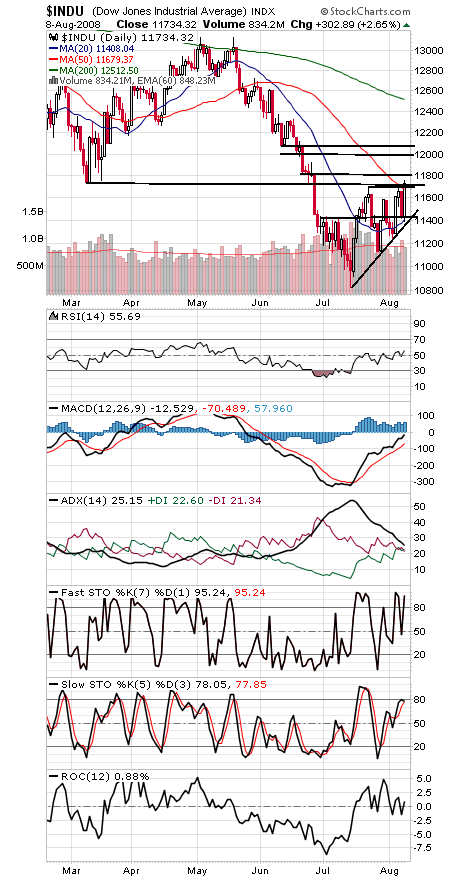
The Dow (fourth chart) is challenging major resistance at 11,750, its 2000 peak and March low. Next up is 11,800 and 12,000-12,080, and support is 11,700, 11,650, 11,600 and 11,400.
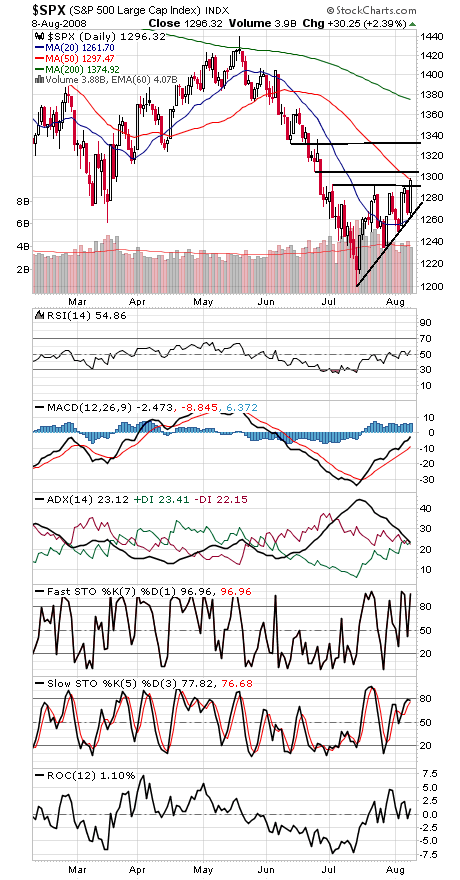
The S&P (fifth chart) has plenty of resistance between here and 1304, with 1330-1335 possible if it can get through the next 8 points. Support is 1292, 1284 and 1268.
Paul Shread is a Chartered Market Technician (CMT) and member of the Market Technicians Association.