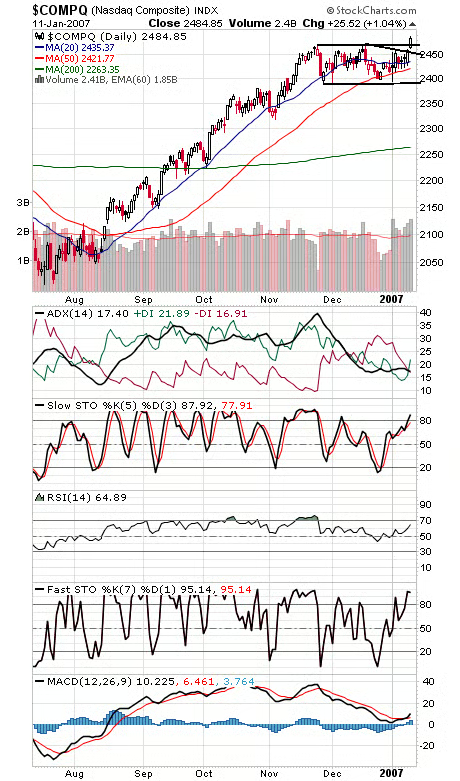
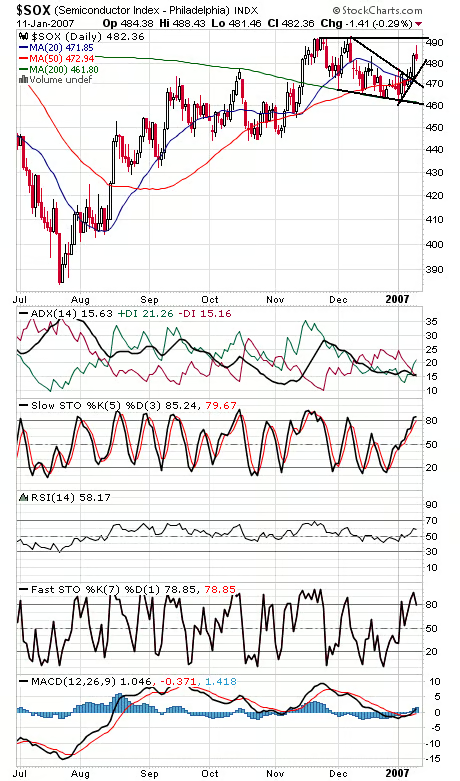
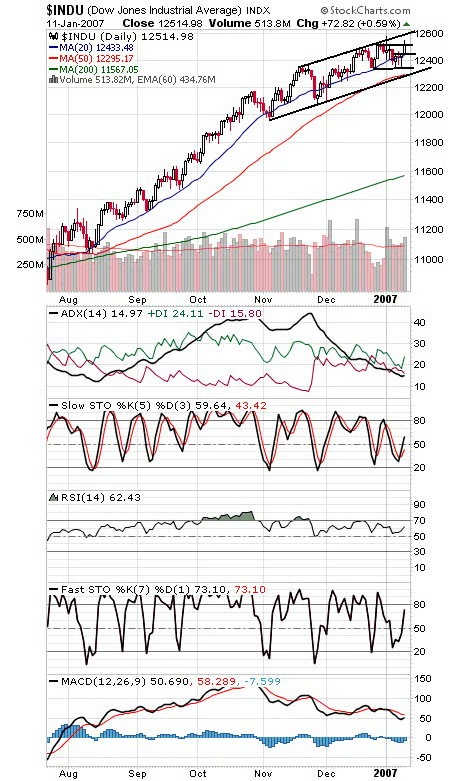
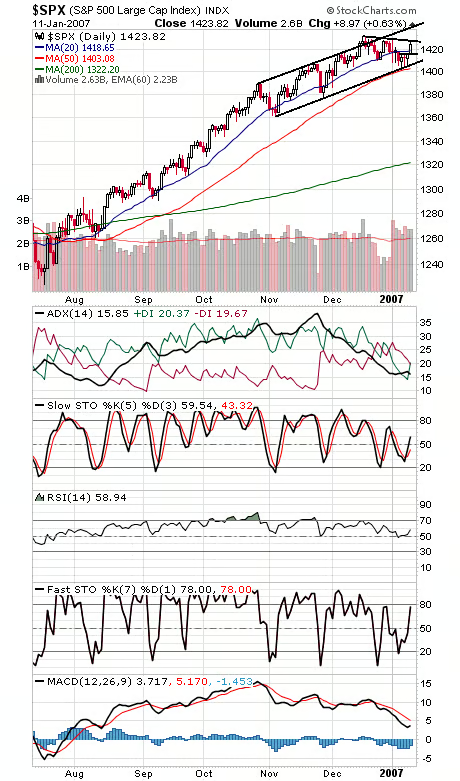
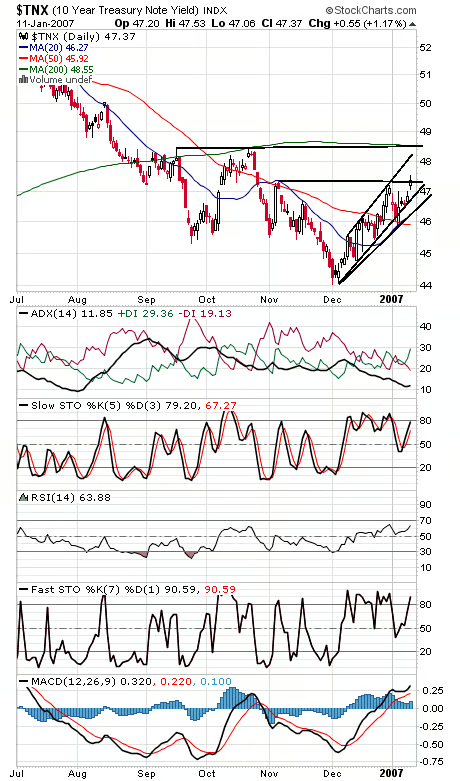
A nice breakout for the Nasdaq (first chart below) today. Just based on the size of that pattern, the techs should see 2550-2590, although we’ll see how the index handles the big round number of 2500 first. 2471 should now be support. It would have been nice to see chip stocks (second chart) join the party, but the semi index is a pretty good-looking chart otherwise. Options indicators got a little frothy on the open today, and upside volume wasn’t as strong as we’d like to see, but stocks otherwise seem pointed up for now. The Dow (third chart) faces resistance at 12,580-12,600, and 12,450 should now be support. The S&P (fourth chart) needs to clear 1427-1432; if it can, it could be headed above 1440. 1416-1419 should now be solid support. Bond yields (fifth chart) resumed their uptrend today. Also note that ADX is beginning to turn up, a suggestion that the trend could gather strength. Could the economy be stronger than thought? Tomorrow’s retail sales data may hold the key.