Technical Analysis: Techs Break Out | Internet News

Technical Analysis: Techs Break Out

Written By
Paul Shread
Paul Shread
Feb 28, 2006
1 minute read

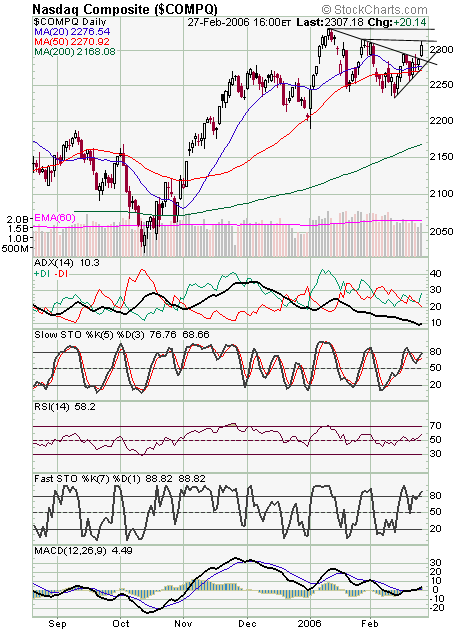
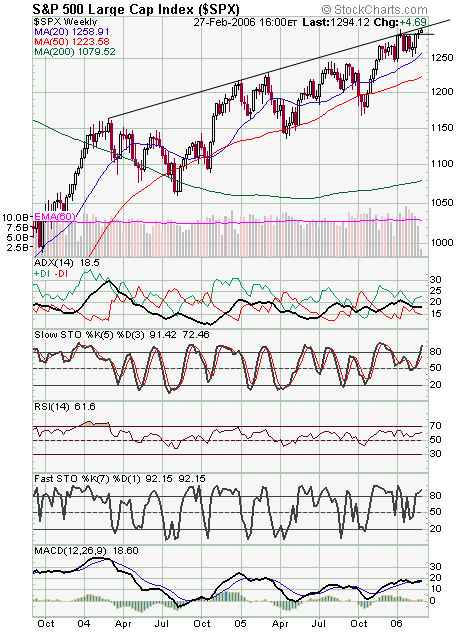
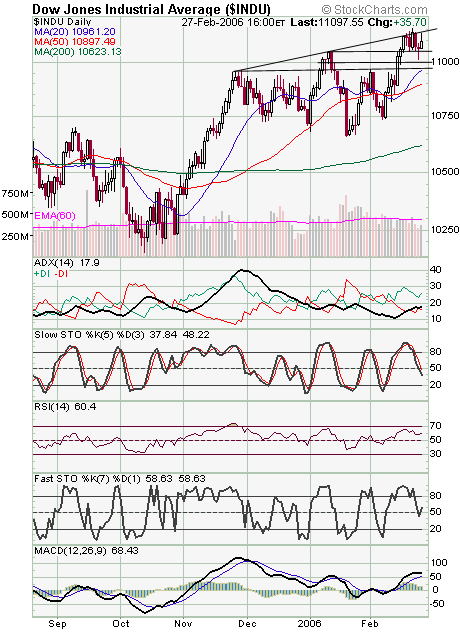
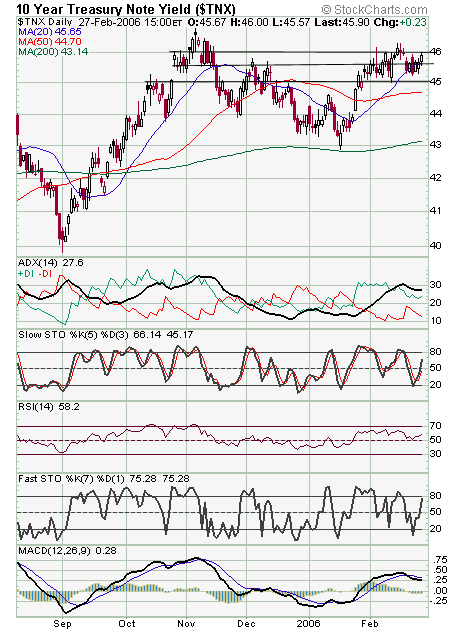
A solid breakout for the Nasdaq (first chart below), which broke its six-week downtrend without looking back. The next resistance levels are 2314 and 2328-2333, and support is 2300, 2291 and 2286. The S&P (second chart) ran into its long-running resistance line at today’s high of 1297.57. Support is 1285-1288, 1282 and 1274-1275. The Dow (third chart) failed at its upper trendline today. Resistance is 11,165 and 11,200, and support is 11,050, 11,000 and 10,960. Long bond yields (fourth chart) are trying to move higher out of their narrow range.


Internet News Logo

InternetNews is a source of industry news and intelligence for IT professionals from all branches of the technology world. InternetNews focuses on helping professionals grow their knowledge base and authority in their field with the top news and trends in Software, IT Management, Networking & Communications, and Small Business.

Property of TechnologyAdvice. © 2026 TechnologyAdvice. All Rights Reserved

Advertiser Disclosure: Some of the products that appear on this site are from companies from which TechnologyAdvice receives compensation. This compensation may impact how and where products appear on this site including, for example, the order in which they appear. TechnologyAdvice does not include all companies or all types of products available in the marketplace.