Technical Analysis: Techs Hang In There | Internet News

Technical Analysis: Techs Hang In There

Written By
Paul Shread
Paul Shread
Mar 31, 2006
1 minute read

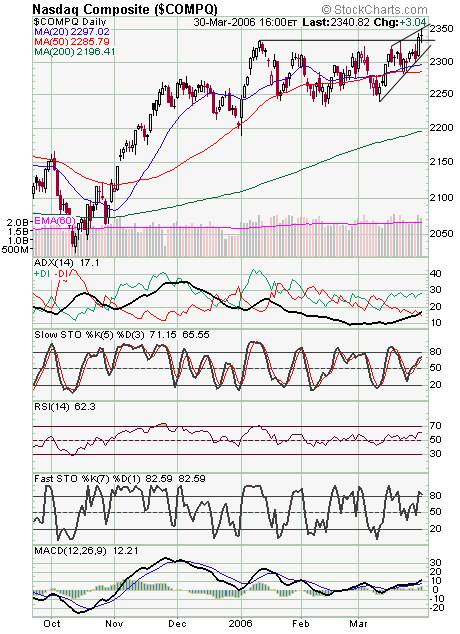
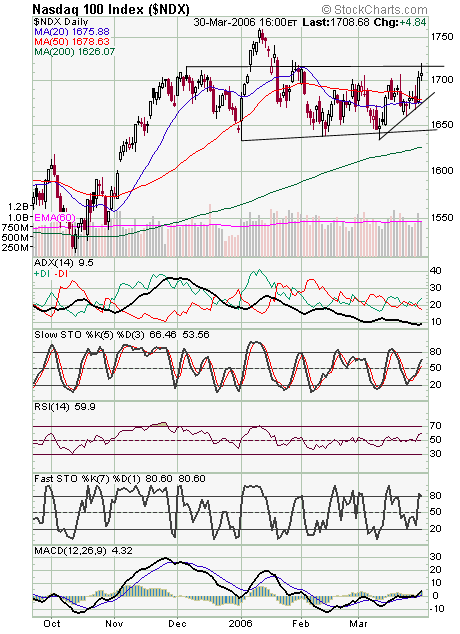
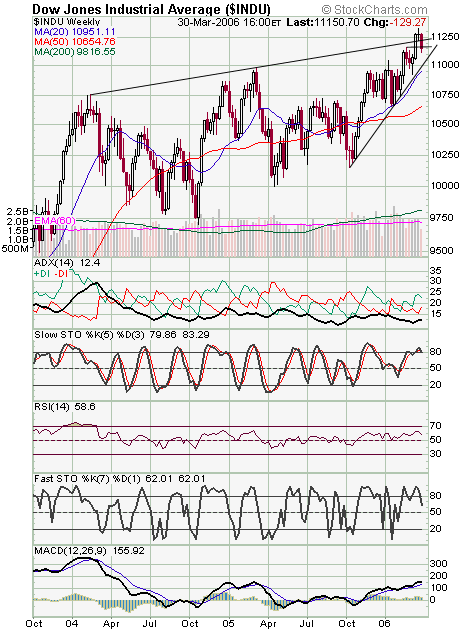
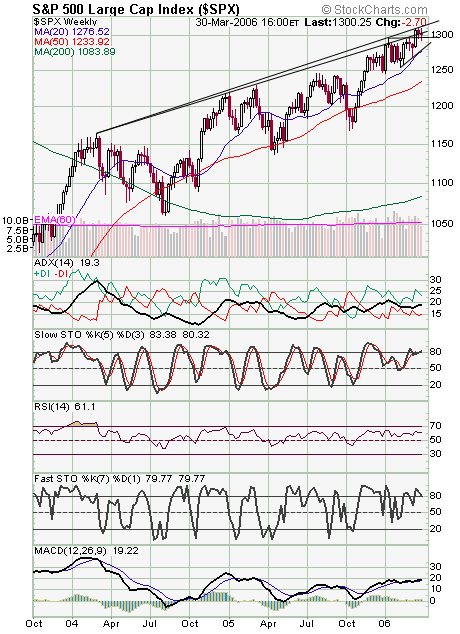
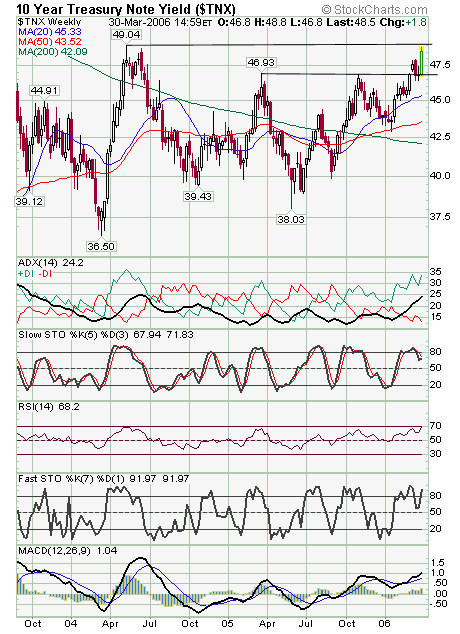
A strong showing on the Nasdaq (first chart below) today, with 2328-2333 support holding nicely. The Nasdaq 100 (second chart), meanwhile, did a little damage to the bearish case by clearing 1717 on an intraday basis, but a stronger move above that level would be even better. 2315 is the next big support on the Nasdaq, and 2355 is resistance — notice that the index is in danger of “wedging out” here. The Dow and S&P (third and fourth charts), meanwhile, continue to struggle below two-year trendlines. 11,000-11,050 is important support on the Dow, and 11,230-11,250 is resistance. 1303-1305, 1310 and 1316 are resistance on the S&P, and support is 1295-1297 and 1292. Long bond yields (fifth chart) continue to follow the Fed funds rate higher, and unless the bond market expects the Fed to begin cutting rates, that pattern may not change.


Internet News Logo

InternetNews is a source of industry news and intelligence for IT professionals from all branches of the technology world. InternetNews focuses on helping professionals grow their knowledge base and authority in their field with the top news and trends in Software, IT Management, Networking & Communications, and Small Business.

Property of TechnologyAdvice. © 2026 TechnologyAdvice. All Rights Reserved

Advertiser Disclosure: Some of the products that appear on this site are from companies from which TechnologyAdvice receives compensation. This compensation may impact how and where products appear on this site including, for example, the order in which they appear. TechnologyAdvice does not include all companies or all types of products available in the marketplace.