Technical Analysis: Techs in Trouble | Internet News

Technical Analysis: Techs in Trouble

Written By
Paul Shread
Paul Shread
Jan 19, 2007
1 minute read

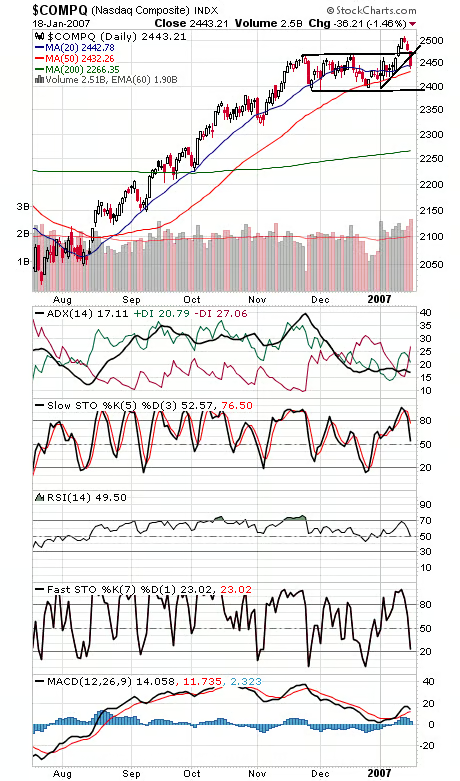
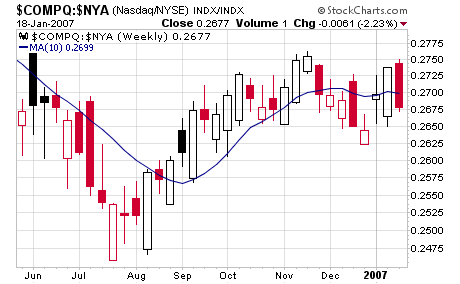
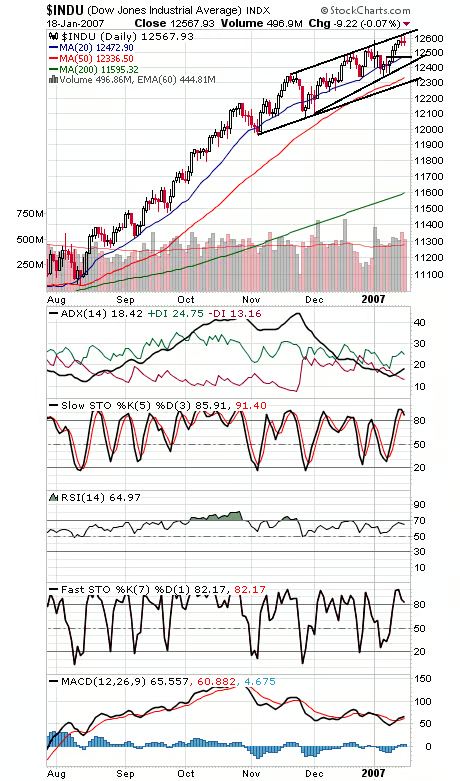
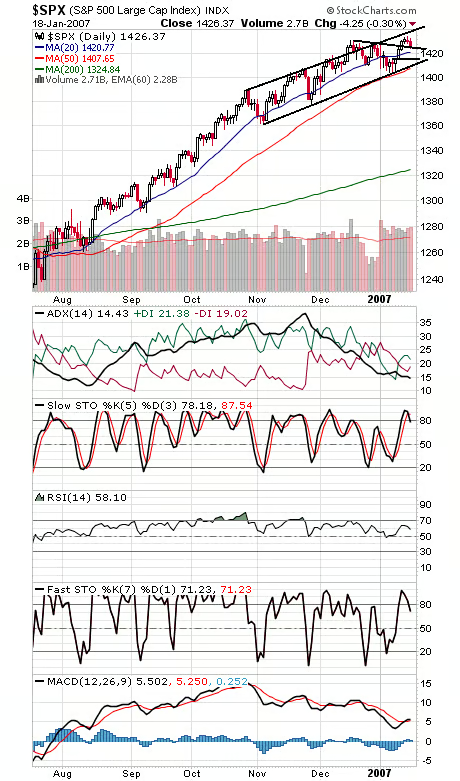
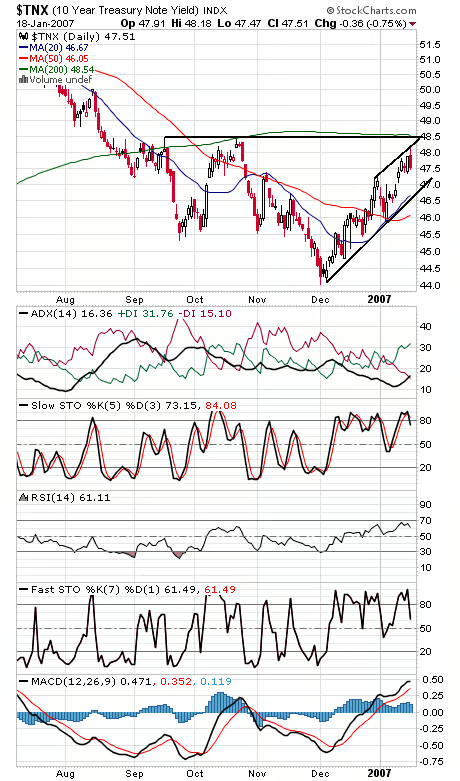
No way to paste a smiley face on today’s action. The Nasdaq (first chart below) gave up its recent breakout at 2471 and could easily end tomorrow with a weekly sell signal under Gerald Appel’s relative strength indicator (second chart). This may be nothing more than selling the news after some very nice gains, but the charts suggest caution here. Blue chips are holding up much better here, but IBM may test their strength tomorrow. At least futures are holding up relatively well tonight, so selling tomorrow may be muted. 2433 looks like good support on the Nasdaq for tomorrow, but 2471 is now resistance again. The Dow (third chart) has resistance at 12,614 and 12,630, and support at 12,547 and 12,466-12,500. The S&P (fourth chart) has support at 1424, 1420, 1416 and 1410, and resistance is 1433-1435 and 1438. Bond bulls (fifth chart) finally caught a break today.


Internet News Logo

InternetNews is a source of industry news and intelligence for IT professionals from all branches of the technology world. InternetNews focuses on helping professionals grow their knowledge base and authority in their field with the top news and trends in Software, IT Management, Networking & Communications, and Small Business.

Property of TechnologyAdvice. © 2026 TechnologyAdvice. All Rights Reserved

Advertiser Disclosure: Some of the products that appear on this site are from companies from which TechnologyAdvice receives compensation. This compensation may impact how and where products appear on this site including, for example, the order in which they appear. TechnologyAdvice does not include all companies or all types of products available in the marketplace.