Technical Analysis: Techs Show Strength | Internet News

Technical Analysis: Techs Show Strength

Written By
Paul Shread
Paul Shread
Dec 3, 2005
1 minute read

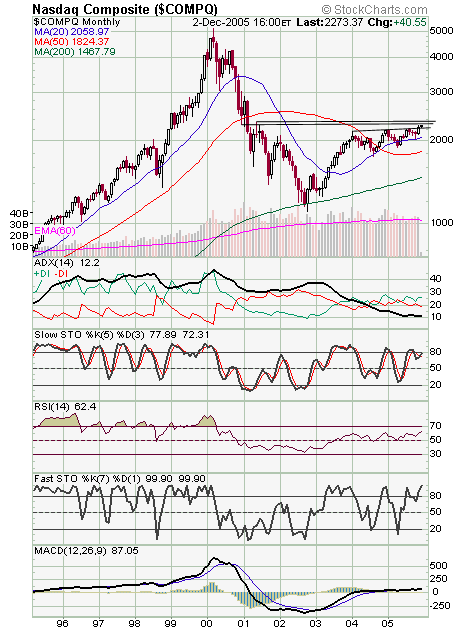
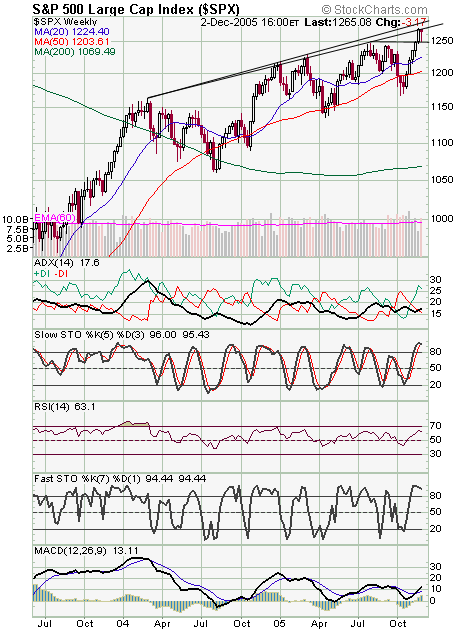
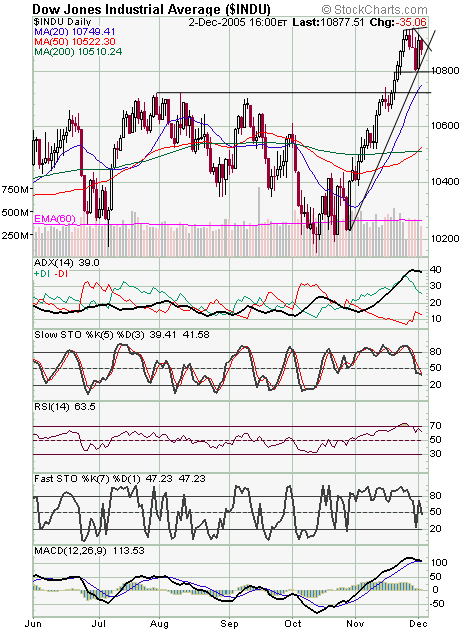
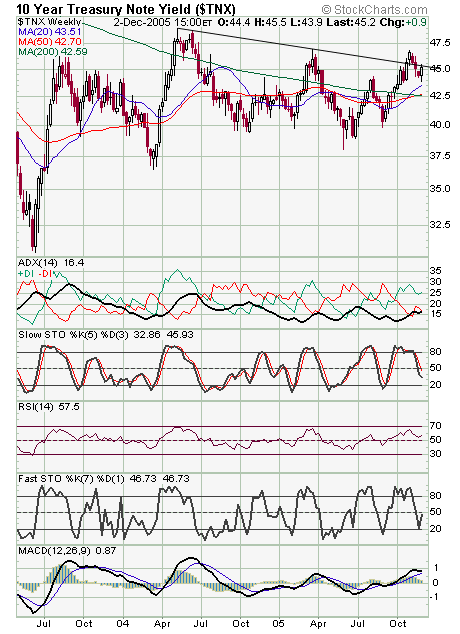
The Nasdaq (first chart below) continues to show strength here, defying a couple of blue chip downdrafts this week. 2269, 2264, 2260 and 2252 are support levels, and resistance is 2288, 2300 and 2328, levels not seen in nearly five years. The S&P (second chart) continues to push some very big resistance at 1270-1280, and support is 1260, 1255 and 1250. The Dow (third chart) still can’t get past 10,950-11,000. 10,880-10,900, 10,860 and 10,800 are supports. Bond yields (fourth chart) continue to be the one worrisome thing for stocks here; no support for equities there.


Internet News Logo

InternetNews is a source of industry news and intelligence for IT professionals from all branches of the technology world. InternetNews focuses on helping professionals grow their knowledge base and authority in their field with the top news and trends in Software, IT Management, Networking & Communications, and Small Business.

Property of TechnologyAdvice. © 2026 TechnologyAdvice. All Rights Reserved

Advertiser Disclosure: Some of the products that appear on this site are from companies from which TechnologyAdvice receives compensation. This compensation may impact how and where products appear on this site including, for example, the order in which they appear. TechnologyAdvice does not include all companies or all types of products available in the marketplace.