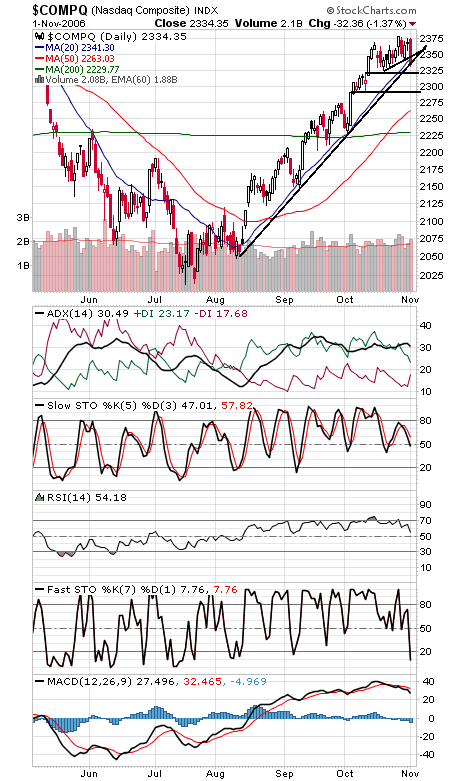
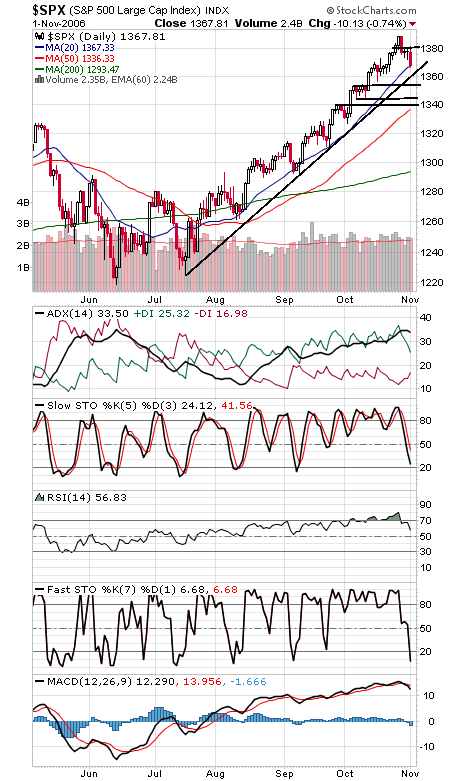
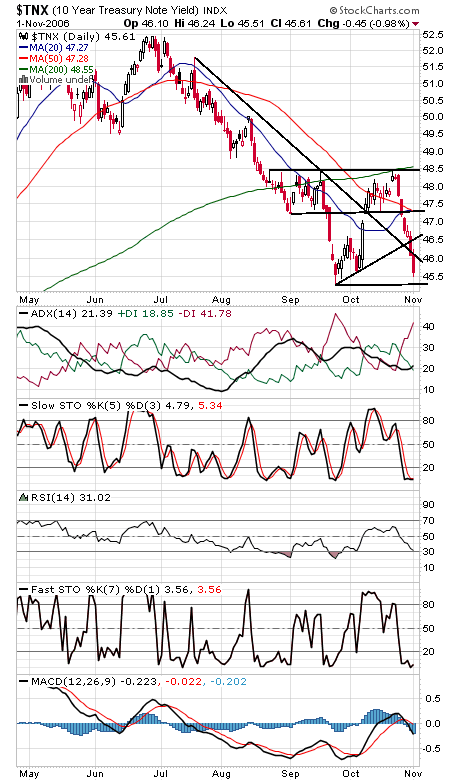
The Nasdaq (first chart below) closed just below its main uptrend line today, a negative for the market. The next support levels are 2330, 2323-2325 and 2290-2300. To regain that broken support, the index needs to get back above 2340, with 2350 the next resistance point above that. On one hand, the move down feels labored, suggesting that we haven’t begun a major down move, but on the other hand, put-call ratios haven’t shown much fear yet, so there may be a bit more of shakeout coming. The Dow and S&P (second and third charts) are now critical supports for the market here. 12,000 and 11,940 are critical levels on the Dow, while the S&P must hold 1362. 12,080 and 12,130 are first resistance on the Dow, and the S&P needs to clear 1382. Only one word for bond yields (fourth chart): Wow. A good example of what can happen when a chart pattern fails, catching traders looking the wrong way. Bond yields have been down four straight days since failing to hold the right shoulder of a potential inverse head-and-shoulders bottom.