Technical Analysis: Techs Stay Stuck | Internet News

Technical Analysis: Techs Stay Stuck

Written By
Paul Shread
Paul Shread
Jul 28, 2006
1 minute read


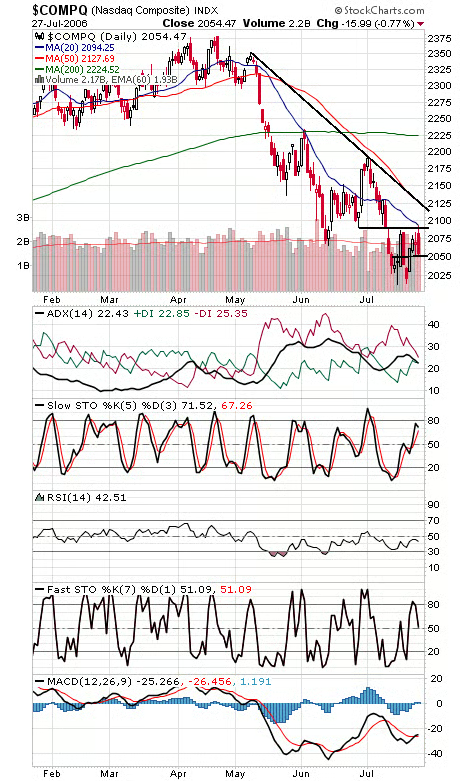
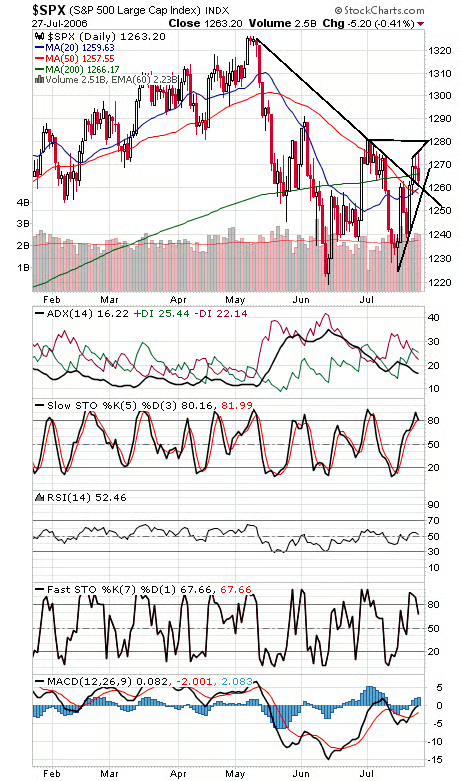
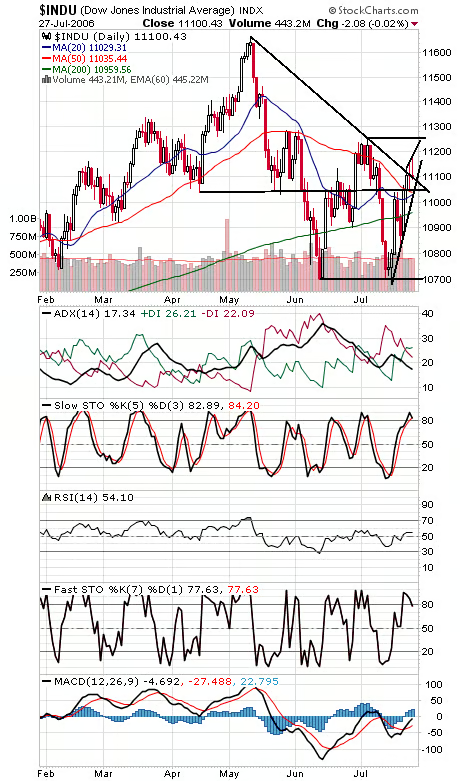
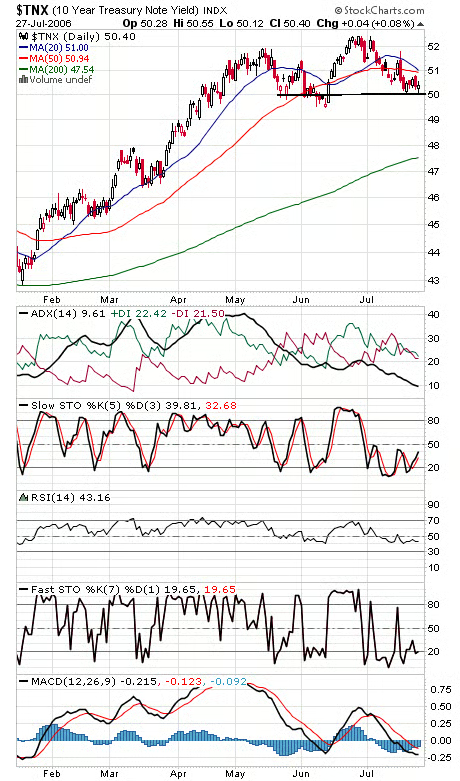
The Nasdaq (first chart below) remains very much range-bound between 2050 and today’s high of 2093; we’ll see if tomorrow’s GDP report will be the catalyst for the index to break out of its trading range. The S&P (second chart) has support at 1260 for tomorrow, and resistance is 1266 and 1277-1281. The Dow (third chart) faces resistance at 11,200 and 11,260-11,290, and support is 11,090, 11,030-11,050, 11,000 and 10,960. Long bond yields (fourth chart) continue to hold above the 5% level; definitely one to watch when tomorrow’s GDP report hits.


Internet News Logo

InternetNews is a source of industry news and intelligence for IT professionals from all branches of the technology world. InternetNews focuses on helping professionals grow their knowledge base and authority in their field with the top news and trends in Software, IT Management, Networking & Communications, and Small Business.

Property of TechnologyAdvice. © 2026 TechnologyAdvice. All Rights Reserved

Advertiser Disclosure: Some of the products that appear on this site are from companies from which TechnologyAdvice receives compensation. This compensation may impact how and where products appear on this site including, for example, the order in which they appear. TechnologyAdvice does not include all companies or all types of products available in the marketplace.