Technical Analysis: Techs Test the Lows | Internet News

Technical Analysis: Techs Test the Lows

Written By
Paul Shread
Paul Shread
Jul 22, 2006
1 minute read

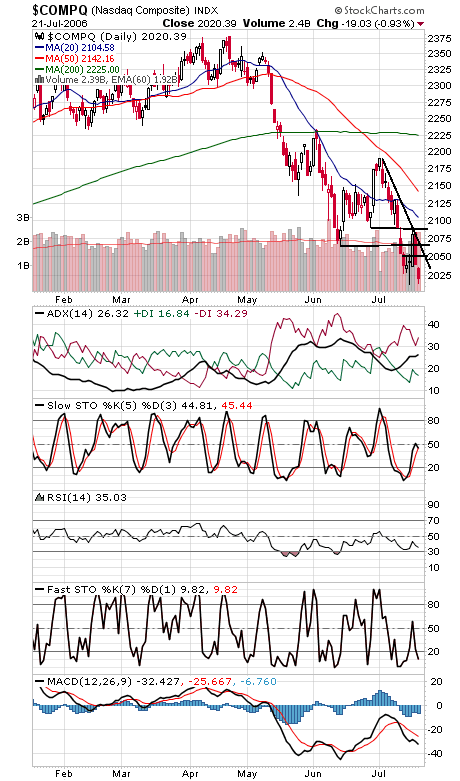
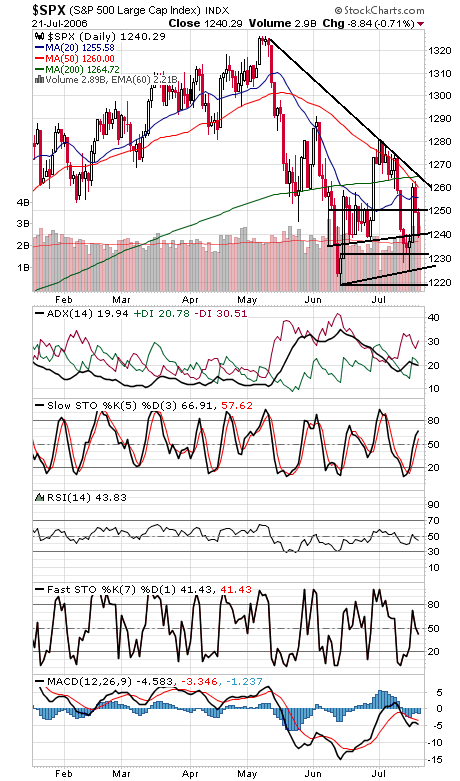
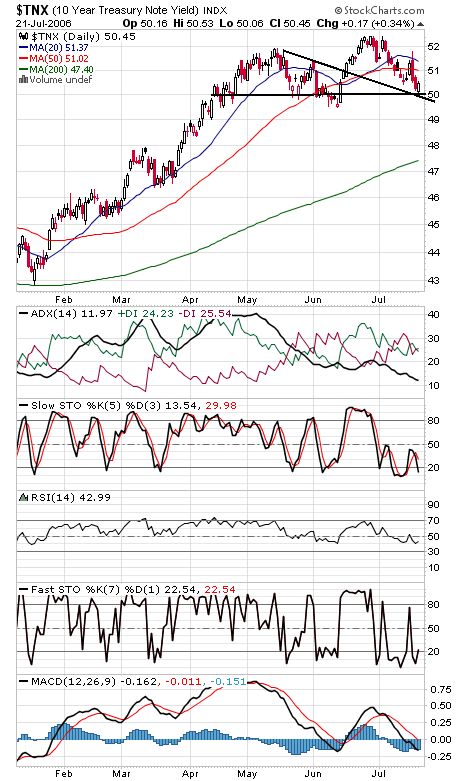
The Nasdaq (first chart below) is once again testing the 2000 level; if that goes, 1850-1900 could be next. On the plus side, the index didn’t set a new intraday low today. To the upside, 2050 is first resistance, with 2065 and 2090-2100 above that. The Dow (second chart) has support at 10,800 and 10,700, and resistance is 10,900, 10,945 and 11,000-11,040. The S&P (third chart) held 1240 support today, an uptrend that dates back to August 2004. Below that, 1232, 1228, 1225 and 1219 come into play. Resistance is 1251 and 1260-1265. Long bond yields (fourth chart) held the 5% level today.


Internet News Logo

InternetNews is a source of industry news and intelligence for IT professionals from all branches of the technology world. InternetNews focuses on helping professionals grow their knowledge base and authority in their field with the top news and trends in Software, IT Management, Networking & Communications, and Small Business.

Property of TechnologyAdvice. © 2026 TechnologyAdvice. All Rights Reserved

Advertiser Disclosure: Some of the products that appear on this site are from companies from which TechnologyAdvice receives compensation. This compensation may impact how and where products appear on this site including, for example, the order in which they appear. TechnologyAdvice does not include all companies or all types of products available in the marketplace.