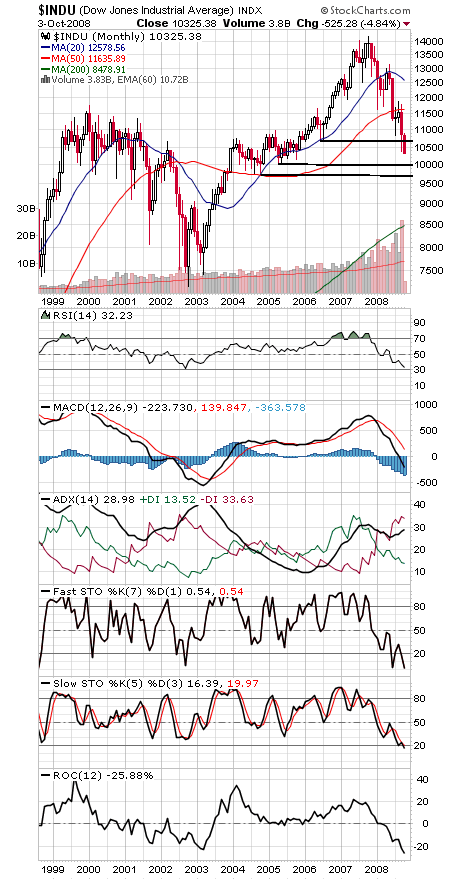
The Dow (first chart below) remains below our major support level of 10,683, which holds a great deal of economic significance — below that level, the economy could face a genuine crisis; above it and the bailout plan just might work.
Also one to watch: the TED spread, which continues to trade at record highs, signaling very tight credit markets.
It will take time to see if the financial rescue plan works, and those two indicators will be as good as any to watch for evidence of the plan’s effectiveness.
To the downside, the Dow has support at 10,000 and 9700, and resistance above 10,683 is 10,750-10,869.
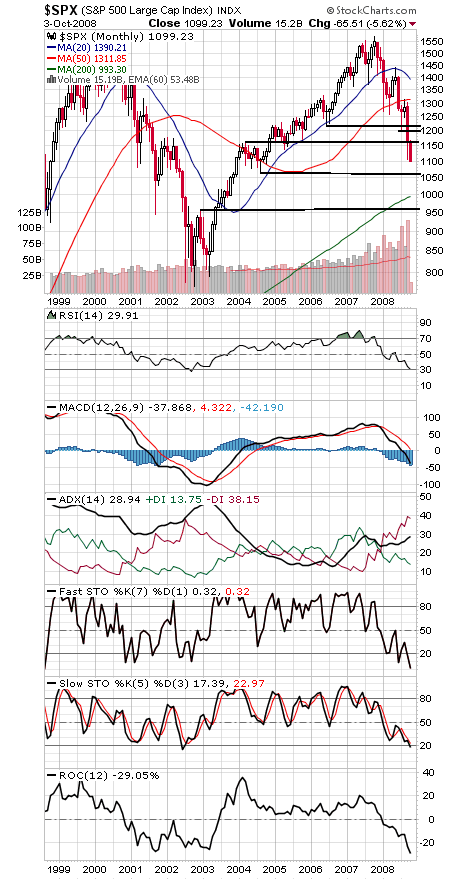
The S&P (second chart) has very important support at 1060, with 1000 and 960 below that. To the upside, 1133, 1153, 1168 and 1200-1219 are resistance.
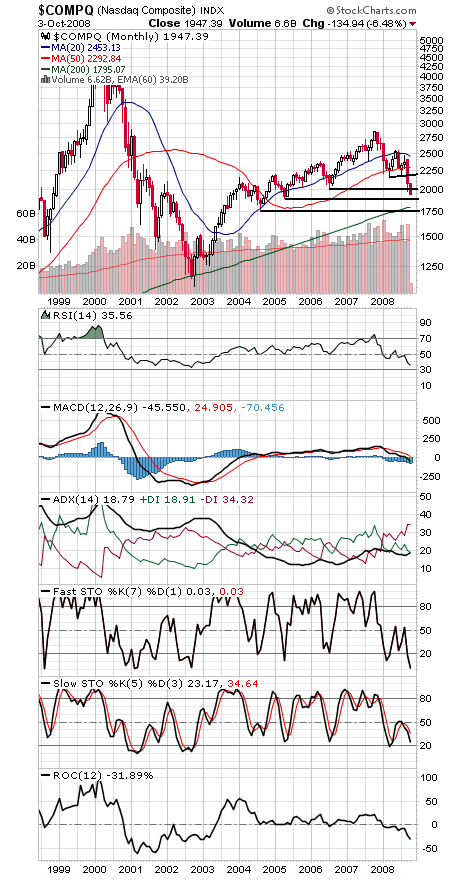
The Nasdaq (third chart) has support at 1890, 1800 and 1750, and resistance is 2000-2012, 2070 and 2155-2167.
Paul Shread is a Chartered Market Technician (CMT) and member of the Market Technicians Association.